

Project performance measurement and evaluation powerpoint presentation slides




Try Before you Buy Download Free Sample Product
 Impress Your
 Audience
 100%
100% Editable
 Save Hours
 of Time


Introducing Project Performance Measurement And Evaluation PowerPoint Presentation Slides. This ready-to-use project performance assessment PPT presentation discusses a summary of the project and its objectives and projected outcomes. It also describes various teams that are assigned for the project with names and designations. Showcase the current work status of different projects, the pain points, and challenges faced by the project team. Highlight project progress through task completion status, allocated, and the actual time taken using this project performance measurement PPT slideshow. The presentation also describes monthly plan hours for project tasks. Also, give detail about different methods used to assess the project delays using project management performance PPT themes. Analyze budget variance, and estimate the cost of resources utilized by the project team by using our professionally designed PowerPoint layouts. Identify risks during the project implementation and ways to mitigate them by quickly incorporating our performance assessment PowerPoint infographics.
People who downloaded this PowerPoint presentation also viewed the following :
Content of this Powerpoint Presentation
Slide 1: This title slide introduces Project Performance Measurement and Evaluation. Add the name of your company here.
Slide 2: This slide contains the Table of Content. It includes – Introduction, Current Status, Methodology of Assessment, Project Schedule Assessment, etc.
Slide 3: This is a table of content slide showing the Introduction. It includes - Project Brief and Team.
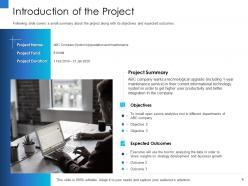
Slide 4: This slide presents the Introduction of the Project. It covers a small summary of the project along with its objectives and expected outcomes.
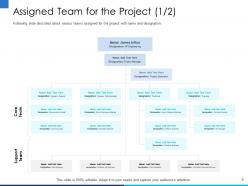
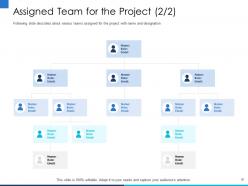
Slide 5: This slide presents the Assigned Team for the Project (1/2). It describes the various teams assigned for the project with name and designation.
Slide 6: This slide presents the Assigned Team for the Project (2/2).
Slide 7: This is a table of content slide showing the Current Status.
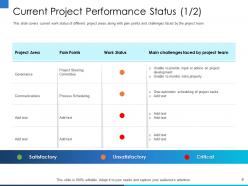
Slide 8: This slide presents the Current Project Performance Status (1/2). It covers the current work status of different project areas along with pain points and challenges faced by the project team.
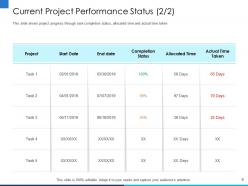
Slide 9: This slide presents the Current Project Performance Status (2/2). It shows project progress through task completion status, allocated time, and actual time taken.
Slide 10: This is a table of content slide showing Methodology of Assessment.
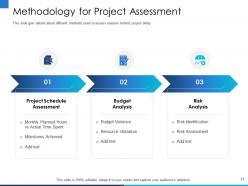
Slide 11: This slide presents the Methodology for Project Assessment. It gives the details of the different methods used to assess the reasons behind project delay.
Slide 12: This is a table of content slide showing the Project Schedule Assessment. It includes - Monthly Planned Hours vs Time Spent and Milestones Achieved.
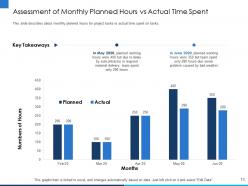
Slide 13: This slide presents the Assessment of Monthly Planned Hours vs Actual Time Spent. It describes the monthly planned hours for project tasks vs actual time spent on tasks.
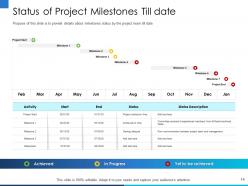
Slide 14: This slide presents the Status of Project Milestones To date. It provides the details about the milestone’s status by the project team to date.
Slide 15: This is a table of content slide showing the Budget Analysis. It includes - Budget Variance and Resource Utilization.
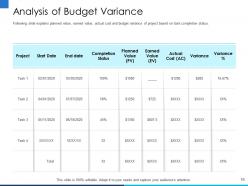
Slide 16: This slide presents the Analysis of Budget Variance. It explains the planned value, earned value, actual cost, and budget variance of the project based on task completion status.
Slide 17: This slide presents the Cost of Resources Utilized by the Project Team. It gives estimated and actual cost details of resources utilized in each task.
Slide 18: This is a table of content slide showing the Risk Analysis. It includes - Risk Identification and Risk Assessment.
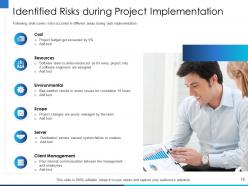
Slide 19: This slide presents the Identified Risks during Project Implementation. It covers risks that occurred in different areas during task implementation
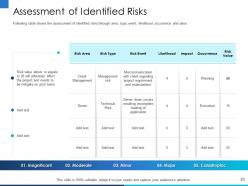
Slide 20: This slide presents the Assessment of Identified Risks. It shows the assessment of identified risks through the area, type, event, likelihood, occurrence, and value.
Slide 21: This is a table of content slide showing How to Overcome Issues?
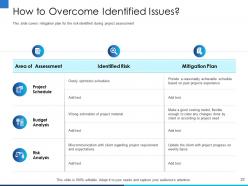
Slide 22: This slide presents How to Overcome Identified Issues? It covers the mitigation plan for the risk identified during project assessment.
Slide 23: This is a table of content slide showing the Dashboards.
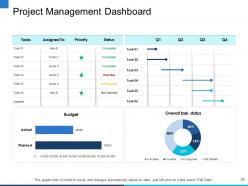
Slide 24: This slide presents the Project Management Dashboard.
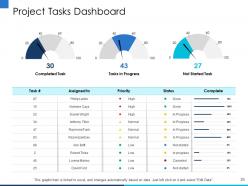
Slide 25: This slide presents Project Tasks Dashboard.
Slide 26: This is the Project Performance Measurement and Evaluation Icons Slide.
Slide 27: This slide introduces the Additional Slides.
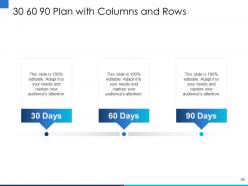
Slide 28: This is a slide with a 30 60 90 Plan with Columns and Rows to set goals for these important intervals.
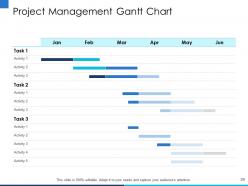
Slide 29: This slide presents the Project Management Gantt Chart.
Slide 30: This slide provides the Mission for the entire company. This includes the vision, the mission, and the goal.
Slide 31: This slide shows the members of the company team with their name, designation, and photo.
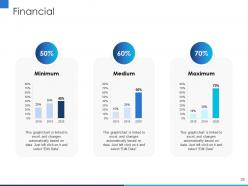
Slide 32: This slide presents the Financial with a data’s numbers at minimum, medium, and maximum percentage.
Slide 33: This slide contains the information about the company aka the ‘About Us’ section. This includes Creative, Preferred by Many, and Professional.
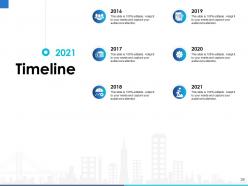
Slide 34: This slide is a Timeline template to showcase the progress of the steps of a project with time.
Slide 35: This is the Quotes slide. Add your favorite quote here.
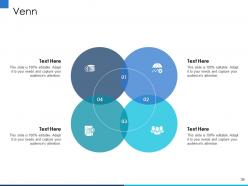
Slide 36: This slide provides a Venn diagram that can be used to show interconnectedness and overlap between various departments, projects, etc.
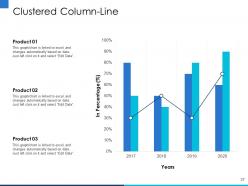
Slide 37: This slide shows a Clustered Column-Line that compares 3 products’ data over a timeline of years.
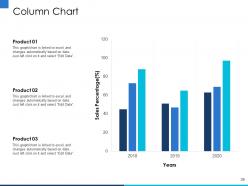
Slide 38: This slide shows a Column Chart that compares 3 products’ sales over a timeline of years.
Slide 39: This is a Thank You slide where details such as the address, contact number, email address are added.
Project performance measurement and evaluation powerpoint presentation slides with all 39 slides:
Use our Project Performance Measurement And Evaluation Powerpoint Presentation Slides to effectively help you save your valuable time. They are readymade to fit into any presentation structure.










FAQs for Project performance measurement and evaluation
Start with the basics: time, cost, and quality. Are you hitting deadlines? Staying on budget? Actually delivering what you promised? Those are your big three. Customer satisfaction scores are clutch too - honestly, happy stakeholders can save your butt even when other stuff goes sideways. Resource utilization matters if you're managing a team. Oh, and track how well you're handling risks before they blow up. But seriously, don't go crazy measuring everything. Pick maybe 4-5 things max that actually tell you if your project's succeeding. You can always get fancier with metrics later once you've nailed the fundamentals.
Dude, those qualitative metrics are what tell you the *why* behind all your numbers. Sure, you hit your budget and deadlines, but what if your team's completely fried or stakeholders hate working with you? I've watched projects that looked amazing on spreadsheets totally implode later. Numbers don't show you team morale or whether people actually enjoyed the process. Get feedback through quick surveys or just talking to people - honestly, sometimes a casual chat reveals more than formal reports. Try matching each big metric with some kind of human insight. You'll catch problems way earlier.
Honestly, stakeholder feedback is like your sanity check - you can nail every deadline and budget target, but if they hate what you built, you're screwed. I've watched so many projects that looked perfect on paper completely bomb because no one bothered asking users what they actually wanted. Their feedback catches problems early and shows you whether you're solving real business needs or just... well, whatever you think needs solving. The trick is getting their input throughout the whole thing, not waiting until the end when it's too late to fix anything. Trust me on this one.
Honestly, project management tools are a game-changer for tracking stuff accurately. Instead of guessing or dealing with messy spreadsheets, you'll get real-time data on budget burn rates, timelines, and how your resources are being used. The automation cuts out so many manual errors it's not even funny. Plus they usually play nice with whatever systems you're already using - which saves your sanity when you're managing multiple projects. Your team will report progress the same way too, so you can actually compare things properly. Oh, and don't go crazy trying to digitize everything at once. Pick one important metric first and build from there.
You need those baseline metrics from day one, or you'll have no clue if your project's actually on track. It's like trying to measure how far you've walked without knowing where you started - makes no sense, right? Document your scope, timeline, budget, and quality targets upfront. Get everyone to agree on them too, because trust me, stakeholders will definitely want to see real progress against something solid. Without baselines, you can't spot problems early or figure out what needs fixing. Plus you'll just be flying blind when making decisions. Set those targets clearly before you dive into the work.
So real-time analytics is basically like having a live feed of your project instead of waiting around for those dreaded weekly reports. Budget going crazy? Timeline falling apart? You'll know immediately, not three weeks later when you're screwed. Think of it as GPS for project management - honestly way more useful than I initially thought it would be. The whole point is making decisions with fresh data instead of stale info. Oh, and definitely set up alerts for your biggest pain points so you're not glued to screens all day checking everything manually.
Ugh, it's such a pain because you're basically trying to measure feelings and vibes, you know? Like how do you even price out "better teamwork" or improved morale? Stakeholders always want those hard ROI numbers, but this stuff takes forever to actually show up - we're talking months or years sometimes. What I've learned is you gotta set up your baseline metrics right at the start. Then use things like survey scores or retention rates as stand-ins for the real benefits. It's not perfect, but honestly it's the best we can do with this kind of soft stuff.
Oh man, scope changes are such a pain because they basically mess up all your original metrics. You can't measure success against your old baseline anymore - the goalposts moved, you know? Your schedule, budget, quality targets... all of it needs updating or you're just kidding yourself about performance. I learned this the hard way on a project last year. Document everything right when it happens and adjust your KPIs to match the new reality. Don't try to keep using the old measurements because you'll get completely useless data that won't tell you how things are really going.
Honestly, just ask each stakeholder what they actually want first - saves so much headache later. Executives are obsessed with those dashboard summaries and red/yellow/green status updates. Project teams want the nitty-gritty details though. Charts work better than walls of text since nobody reads those anyway. Weekly updates for active stuff, monthly for the longer projects. Oh, and try to chat face-to-face when you can. Emails lose all the nuance and people misread everything. Once you figure out their preferences, stick with it. Consistency matters way more than being fancy about it.
Honestly, post-project reviews are where you find all the good stuff for next time. Half the metrics you obsessed over probably didn't matter at all - meanwhile, something crucial slipped through the cracks. You'll spot timing issues too, like measuring way too late or annoying everyone with constant check-ins. The real eye-opener? Seeing what stakeholders actually used to make decisions versus what you thought they'd care about. I always feel a bit silly looking back at my original measurement plan. But that's the point - take those "oops" moments and bake the lessons into your next project from the start.
Look, EVM breaks down into three numbers: planned value (what you should've spent), earned value (what you actually got done), and actual cost (what you really spent). The math part? Not as bad as it seems, trust me. When your schedule performance index drops below 1.0, you're running late. Below 1.0 on cost performance means you're bleeding money. Here's the thing though - you catch problems early before everything goes sideways. I'd track these weekly if I were you. Way better than finding out you're screwed at the end.
Looking at how similar projects performed is honestly a game changer. You'll spot what keeps causing delays and figure out which estimation methods don't suck. Plus you get real benchmarks instead of pulling numbers out of thin air - which let's be honest, we've all done. The trick is comparing apples to apples though. Scope and team size need to match up. I'd grab data from your last 3-5 projects that are actually comparable. Look for obvious patterns first, then dig deeper. It's way better than guessing your way through the next project timeline.
Oh man, this stuff can totally throw off your metrics if you don't watch out. Like, some people won't mention problems because they don't want to look bad, while others will be brutally honest about everything. Your US team probably cares more about individual wins, but colleagues from Asia might prioritize group success over personal recognition. Time's weird too - your "urgent" deadline might feel perfectly reasonable to someone else. Honestly, I've seen this mess up so many projects. Best thing? Set clear success measures that work for everyone upfront. Then create different ways for people to give feedback so they'll actually tell you what's happening, not just what sounds good.
So AI can actually predict when your projects are gonna go sideways by looking at past data patterns - pretty cool stuff. Real-time dashboards show you what's happening with your team and resources instantly. Blockchain's creating permanent project records, but honestly most companies aren't using it yet (too complicated maybe?). There are tools now that read through status reports and pull out the important bits automatically - saves tons of time. I'd start with AI analytics platforms. They're way easier to set up than the other stuff and you'll see results fast.
So basically you're testing what happens when you mess with different parts of your project - like budget, timeline, resources, that kind of stuff. Change one thing at a time and see how badly it screws everything up (or doesn't). Honestly, it's kind of like poking your project plan to find the weak spots before they bite you later. Try cutting your budget by 20% or losing a month from your deadline. You'll figure out pretty quick which variables actually matter and which ones are just noise. Pick your top 3-5 most critical factors and run different scenarios for each one.
-
Commendable slides with attractive designs. Extremely pleased with the fact that they are easy to modify. Great work!
-
Commendable slides with attractive designs. Extremely pleased with the fact that they are easy to modify. Great work!
-
Nice and innovative design.
-
Easily Editable.