

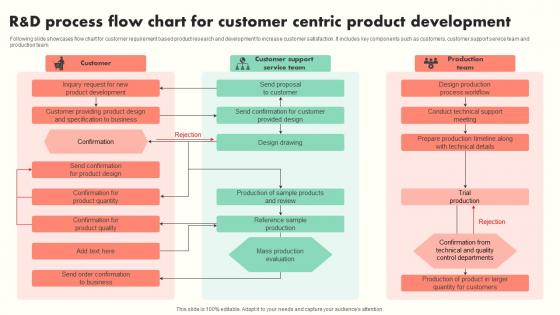
R And D Process Flow Chart For Customer Centric Product Development




Try Before you Buy Download Free Sample Product
 Impress Your
 Audience
 100%
100% Editable
 Save Hours
 of Time


Following slide showcases flow chart for customer requirement based product research and development to increase customer satisfaction. It includes key components such as customers, customer support service team and production team
People who downloaded this PowerPoint presentation also viewed the following :
R And D Process Flow Chart For Customer Centric Product Development with all 6 slides:
Use our R And D Process Flow Chart For Customer Centric Product Development to effectively help you save your valuable time. They are readymade to fit into any presentation structure.






FAQs for R And D Process Flow Chart For Customer
So there's usually five main stages: ideation, feasibility analysis, prototyping, testing/validation, then commercialization. Nothing's ever linear though - there's feedback loops everywhere because stuff breaks or doesn't work like you thought it would. Each phase has deliverables and decision points where you figure out if you keep going, change direction, or scrap it entirely. Industries vary a bit, but those core steps are pretty universal. Oh, and mapping your current projects against this might show you where things are getting stuck. Trust me, there's always a bottleneck somewhere.
Honestly, having a solid flowchart is a game changer - it stops people from working in their own little bubbles. Everyone can see what's coming next and when they need to loop in other teams. No more guessing about deadlines or who's supposed to do what. The handoffs become way less painful too (which, let's be real, is where most projects die). I'd start by mapping what you're already doing. Then figure out where people usually drop the ball on communication. Build those check-ins right into your chart so they can't be ignored.
Look, your R&D flow chart is probably just sitting there looking nice but not actually working, right? Here's the thing - you need someone juggling all those connected phases and keeping track of what depends on what. Otherwise teams just do their own thing and handoffs turn into a mess. Project managers make sure research actually flows into development, then testing, then whatever comes next. They set up clear rules for when you can move between stages and keep resources moving. Honestly, most flow charts are just wishful thinking without someone running the show. Figure out who's supposed to handle each transition point first.
Compliance is basically like having guardrails through your whole R&D process. Don't treat it as an afterthought - trust me on this one. Build checkpoints into each phase from the start. Yeah, it means more paperwork and longer timelines, but way better than discovering your product won't pass review after you've spent months developing it. First thing you should do is figure out which regulations actually apply to your specific product. Then design your workflow around those requirements from day one. Honestly saves so much headache later.
Honestly, just use whatever your team already has first. Visio's the classic choice if you've got Microsoft licenses - tons of templates and it's made for this stuff. Lucidchart's solid for collaborating in real time. I'm weirdly obsessed with Miro for brainstorming because it's so visual, but fair warning - it gets chaotic quick. PowerPoint works fine for basic charts too, don't overthink it. Oh, and draw.io is free and actually pretty decent if budget's tight. Start simple, then upgrade later if you need fancier features.
You really need to look at what your specific industry actually requires first. Pharma companies have to deal with all those clinical trial phases that software startups completely skip. Manufacturing is all about prototyping and testing, while service businesses focus way more on pilot programs and getting customer feedback. Honestly? There's no magic template that works for everyone. I'd start by checking out how your biggest competitors structure their R&D process - gives you a decent starting point. Then just adapt that basic discover-develop-test-launch thing to include whatever regulatory stuff and checkpoints your industry throws at you. Map out the typical hurdles and constraints you'll face.
Track cycle times for each R&D stage plus milestone completion rates - that's your basic health check. Budget variance matters too, obviously. For the innovation side, look at patent apps, prototype success rates, and how long products take to hit market. Stakeholder feedback at key gates is huge (learned this the hard way). You're basically balancing speed vs quality here. Can't rush and make crap, but perfectionism kills momentum. I'd start with maybe 3-4 solid metrics per stage. Add more once you've got the hang of it.
Dude, this flow chart thing is actually pretty smart. You can see exactly which parts of your project need the most cash and people. No more spreading your team too thin or randomly throwing money at stuff. Honestly, I used to always run out of budget halfway through projects - super annoying. Now I can spot where things might get jammed up before it happens. Just map your current project against it and you'll probably find some weird spots where you're either spending way too much or barely anything. Makes moving people around way easier too.
Don't make it too linear - R&D is messy and never goes straight from start to finish. Feedback loops are huge. Also your team will hate you if you cram every tiny detail into each box. Keep decision points where projects can pivot or die completely (honestly the most realistic part). Oh, and this might sound obvious but actually talk to your R&D people first. They know what really happens day-to-day versus what looks good on paper. I've seen so many flowcharts that were beautifully theoretical but totally useless because nobody asked the actual users what they needed.
So instead of that straight research → develop → test → launch thing, you're basically spiraling through mini-versions over and over. Way messier looking but honestly? Works so much better in real life. You keep cycling back to earlier steps when you learn something new or hit a wall. The trick is setting up actual decision points where your team knows "okay, time to loop back and try again." Document what triggers each loop so everyone's on the same page. My old boss used to call it "productive chaos" - kinda dramatic but he wasn't wrong.
Add feedback arrows going backward from each stage - testing back to design, market validation back to concept development, stuff like that. Make these loops visible and label them clearly ("design iteration" or "requirement revision"). Build in review gates where you actually decide whether to loop back or move forward. Honestly, so many teams skip this part then complain their process feels way too rigid! Start by mapping where you're already iterating informally - we all do it anyway. Then just formalize those as official feedback loops in your chart. Your team needs to know these paths exist and when to use them.
Honestly, set up quarterly reviews or you'll forget about it completely. Get your key people together for quick sessions to spot what's broken or outdated. People already complain about messy processes anyway - might as well channel that into something useful! Make it super easy for your team to flag issues when they hit them. Here's the thing though - assign one person as the owner. Otherwise everyone thinks someone else will handle updates and nothing gets done. Simple feedback system works, but you actually have to use the input you collect.
Honestly, you're gonna miss so much if you don't talk to people first. Different teams see totally different bottlenecks - researchers worry about one thing, project managers about another. I'd grab quick chats with everyone who touches your R&D process, even customers if possible. Those conversations will show you decision points and approval stages you never thought of. Trust me, I've watched people build these beautiful flowcharts that completely ignored how teams actually work together. Start by figuring out who's involved, then just ask them what sucks about the current process. Way better than guessing.
Honestly, diagrams and flowcharts make R&D so much clearer than walls of text. New people can actually see how ideas flow into real products instead of getting lost in documentation hell. Stakeholders spot problems faster when they're looking at visual timelines – like, way faster than reading through process docs. I swear you'll find bottlenecks you never noticed before. Plus it's easier to catch redundant steps or missing pieces. Map out what you're doing now visually and I bet you'll be surprised by the inefficiencies hiding in plain sight.
Think of R&D flowcharts like GPS for your innovation projects - they show you exactly where things get stuck. Super helpful for spotting bottlenecks and figuring out realistic timelines. Honestly, stakeholders love visual stuff way more than lengthy explanations. You can standardize your approach across projects while still leaving room for creativity (which sounds contradictory but somehow works). Resources get allocated better when you actually see the whole pipeline laid out. Oh, and definitely review yours every quarter - I've seen too many teams stick with flowcharts that look pretty but don't match reality.
-
Enough space for editing and adding your own content.
-
I have just started downloading templates for my presentations and I must say this is a great design. It helped accelerate my presentation design process and made it more visually appealing.