


Product Manufacturing Process Flow Chart With Quality Control




Try Before you Buy Download Free Sample Product
 Impress Your
 Audience
 100%
100% Editable
 Save Hours
 of Time


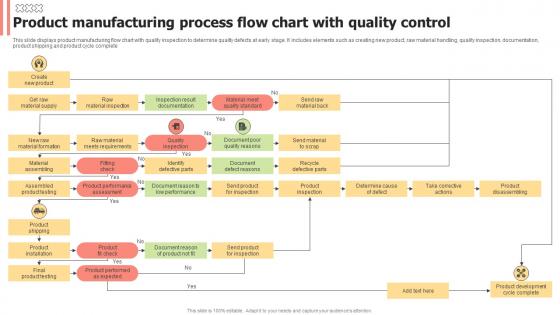
This slide displays product manufacturing flow chart with quality inspection to determine quality defects at early stage. It includes elements such as creating new product, raw material handling, quality inspection, documentation, product shipping and product cycle complete
People who downloaded this PowerPoint presentation also viewed the following :
Product Manufacturing Process Flow Chart With Quality Control with all 6 slides:
Use our Product Manufacturing Process Flow Chart With Quality Control to effectively help you save your valuable time. They are readymade to fit into any presentation structure.





FAQs for Product Manufacturing Process Flow Chart
So basically you start with design and planning, then move into sourcing all your materials. Production comes next - that's where things get real. Quality control and testing follow that, then packaging and shipping. Here's the thing though - if you screw something up early, it's gonna mess with everything downstream. Honestly, I'd map out your whole process with actual timelines first. Sounds boring but it'll save you from those nightmare bottlenecks that cost a fortune to fix later. Trust me on that one.
Honestly, flow charts are game-changers for manufacturing stuff. You can see the whole process laid out visually instead of drowning in boring procedure documents. Bottlenecks jump right out at you. Training new people becomes so much easier too - nobody wants to read through endless manuals, right? I'd definitely start by mapping what you're already doing first. Then you can spot the redundant steps or places where quality checks are missing. It's way better than trying to figure this out from written procedures alone. You'll find improvement opportunities you didn't even know existed.
So you've got ovals for start/end points, rectangles for your basic process steps, and diamonds when there's a decision to make. Arrows just show which way things flow. Oh, and circles are for inspections - quality checks and stuff like that. Triangles mean storage or inventory, though honestly I mix that one up with other symbols sometimes. There's also parallelograms for inputs and outputs. When your flowchart gets crazy long, those little connector circles help you split it across pages without losing your mind. These basics will cover like 90% of what you need.
Honestly, flow charts are game-changers for this stuff. Map out each step and time how long everything takes - you'll spot bottlenecks instantly. Like if one machine cranks out parts in 10 minutes but the next step only needs 2, boom - there's your problem. Way better than staring at boring spreadsheets all day. I always write the timing directly on the chart so it's right there. Once you see the whole process laid out visually, those slow spots jump out at you. It's wild how obvious the issues become when you can actually see the flow instead of just thinking about it.
So quality control is basically like having multiple safety checks throughout your whole process, not just at the end. Raw materials get checked when they come in, then again during the main production steps, and once more before packaging. I learned this the hard way at my old job - catching problems early saves you so much money compared to finding them later. Short checkpoints work better than one massive inspection at the finish line. Plus you'll spot patterns in your process that need tweaking. Just build these stops right into your flow chart from the start instead of tacking them on later.
Honestly, just dump everything on a whiteboard first - it's gonna get messy but that's fine. Map out what has to happen before other stuff can start. Find your bottlenecks early because those will totally dictate your timeline. Look for things you can run at the same time instead of one after another. Don't forget about practical stuff like whether you'll actually have the equipment and people when you need them. I always run through a couple different scenarios with my team before we commit to anything - saves headaches later. The whole point is just keeping things moving without wasting time.
Honestly, digital flowchart tools are a lifesaver compared to those whiteboard meetings from hell. Everything just snaps into place automatically, and you can share stuff instantly with your team. The coolest part? Everyone can jump in and edit at once – no more forwarding files back and forth like it's 2005. Most tools let you pull in real data too, which is pretty neat. Templates are clutch for getting started quickly. I'd say try Lucidchart first, though draw.io works fine if you're being cheap about it. Way less headache overall.
Dude, flow charts are seriously clutch for training newbies. You can show them the whole manufacturing process visually instead of handing over some massive manual they'll never read. New people actually remember stuff better when they can see how everything connects - like where quality checks happen, what comes next, how to handle screw-ups. I mean, we've all been there trying to memorize processes from dense text, right? Walk through it with them first, then they've got their handy reference guide for later. Way better than having them bug you with the same questions over and over.
Dude, flow charts are like magic for getting different teams on the same page. Engineers and production people stop talking past each other when they can actually see what happens at each step. You'll spot bottlenecks way faster too - there's something about everyone staring at the same diagram that makes problems obvious. Plus they show who does what and where stuff gets passed between departments. Honestly, I was skeptical at first but tried one in our last cross-functional meeting and decisions happened so much quicker. Worth a shot for sure.
Honestly, most people only update theirs when an audit's coming up - don't be that person. Any major change should trigger an update: new equipment, different suppliers, safety changes, whatever. The actual process drifts from documentation way more than you'd think, so check quarterly if you can swing it. Set a reminder for every 3-6 months and make someone responsible for it. Oh, and if something breaks and you realize your flowchart was totally off, that's obviously update time too. I learned this the hard way when our process had changed like three times but nobody bothered documenting it.
Honestly? The hardest part is when processes change and nobody updates the flowcharts. Happens all the time. Your team will just ignore them if they don't match what's actually happening. Complex charts slow everyone down too – people hate that. Oh, and training everyone to read the damn things takes forever upfront. You can't capture every weird exception that pops up either, which is annoying. My take: pick one critical process to start with. Keep it simple. Once people see it works, then you can get fancier with the rest.
Honestly, process flow charts are game-changers for spotting where your manufacturing is screwing up. They'll show you bottlenecks, waste, all that stuff that's slowing you down. What I really like about them is how they make problems visual - way better than sitting in meetings talking about abstract issues that nobody can actually picture. Map out your worst process first, step by step. Then you can test small tweaks and see what actually moves the needle. Quality problems? You'll see where they pop up. Handoff delays between teams? Super obvious once it's all laid out. Start small though.
Track your defect rates, cycle times, and throughput at each stage - that's your foundation right there. Equipment downtime and first-pass yield matter too. Don't forget waste stuff like scrap rates and rework percentages, plus labor hours per unit. Honestly though? You'll go crazy if you try tracking everything at once. Pick maybe 4-6 metrics that actually help you make decisions. I'd start with whatever's causing you the biggest headaches right now - like we spent way too long tracking random stuff that didn't even matter. Focus on your real bottlenecks first, then build from there.
So here's what I'd do - grab your actual performance data and compare it to what you mapped out. Track how long things really take, where stuff gets stuck, error rates, all that. Honestly, I've watched so many gorgeous flowcharts just sit there while everyone ignores them completely! Walk around and see if people actually follow your steps. Measure throughput at each point. If your team keeps going "wait, what happens next?" then something's not clicking. The good ones get updated constantly based on what's actually happening, not what we think should happen.
Yeah, totally doable! I'd start by color-coding the value-added stuff vs the wasteful steps - makes it super visual. Map out where you're seeing bottlenecks, waiting around, or those annoying handoffs that don't really add anything. Honestly, once you see it laid out like that, the problems just jump out at you. Add cycle times next to each step too. Oh, and you can build improvement loops right into the chart itself, which is pretty neat. Maybe try it on just one process first though - see how your team likes it before going crazy with the whole operation.
-
“I always have a wonderful experience with SlideTeam. It's my ""go to"" when I need a template.”
-
Great quality slides in rapid time.