


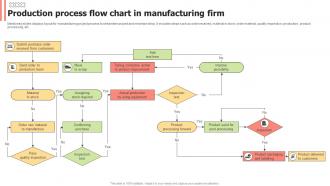
Production Process Flow Chart In Manufacturing Firm





Try Before you Buy Download Free Sample Product
 Impress Your
 Audience
 100%
100% Editable
 Save Hours
 of Time


Mentioned slides displays layout for manufacturing project process to streamline project and minimize delay. It includes steps such as order received, material in stock, order material, quality inspection, production , product processing, etc.
People who downloaded this PowerPoint presentation also viewed the following :
Production Process Flow Chart In Manufacturing Firm with all 6 slides:
Use our Production Process Flow Chart In Manufacturing Firm to effectively help you save your valuable time. They are readymade to fit into any presentation structure.





FAQs for Production Process Flow Chart
So you'll need input materials, process steps, decision points, and outputs obviously. Don't forget the flow arrows and quality checkpoints - plus any waiting areas where stuff just sits around. Honestly, I always mess up the decision diamonds initially but they're crucial for showing where things branch off or need approval. Number your steps or make the directional flow super clear so people can actually follow it. Oh, and map what you're doing now first before trying to fix anything. Way easier to improve when you know your starting point.
Honestly, flow charts are game-changers for getting everyone on the same page. No more "wait, I thought YOU were doing that" confusion because everything's mapped out visually. Your whole team can look at the same diagram and actually understand the process the same way. I swear, half the workplace drama I've seen just disappears once people draw things out. Who does what becomes obvious, handoffs make sense, and when you're training someone new? Just show them the chart instead of rambling for an hour. My advice - don't overthink it at first. Map out exactly how things work now, even if it's messy.
Honestly, go with Microsoft Visio if you can - it's built for exactly this and has all the manufacturing symbols already there. Lucidchart's pretty solid too, especially if your team needs to work on it together since it's all online. Oh, and don't even think about using PowerPoint for this (learned that one the hard way). Draw.io is decent if you're on a tight budget since it's free. SmartDraw has some nice templates that don't look like garbage. I'd probably start with Lucidchart's free trial - you can bang out something decent super quick, maybe half an hour tops.
Honestly, just track how long each step takes and you'll see where stuff gets backed up. The flow chart helps a ton because bottlenecks literally jump out at you visually. I usually check which processes need the most resources first - those are almost always your problem spots. Short cycles? Good. Long ones? That's where you're bleeding time. Mark those slow areas on your chart, then compare what's actually happening versus what should be happening. Once you've got that mapped out, tackle the bottlenecks that'll give you the biggest speed boost first. Pretty straightforward once you start measuring things.
So basically you've got rectangles for process steps and diamonds for decisions - those are your bread and butter. Start/stop points use ovals. Arrows show which way everything flows (obviously lol). Parallelograms are for inputs and outputs if you need them. Circles work as connectors when your flowchart gets all sprawling and messy across pages. Sometimes triangles show delays or storage stuff. Honestly, just stick with rectangles and diamonds at first - you can always get fancier later. The biggest thing? Don't randomly switch between different symbols for the same thing or everyone will be lost.
Dude, flow charts are game changers for production stuff. Map out your whole process and you'll be amazed at the weird bottlenecks that pop up - way better than just wandering around trying to figure out what's broken. Materials getting stuck somewhere? Redundant steps eating time? It becomes super obvious when it's all laid out visually. Your team will actually be on the same page for once since everyone's looking at the identical process. Training new people gets easier too. Oh, and troubleshooting becomes less of a nightmare when you have that roadmap. Just start with mapping what you're doing now, then hunt down the obvious problems.
So flow charts are basically your quality control best friend. Map out your current process first, then figure out where to stick your checkpoints. They're super helpful for training people the right way and catching those annoying repeat defects - you know, the ones that keep showing up in the exact same spot? Short sentences work great for spotting bottlenecks before they blow up into bigger problems. The visual thing really works too since you can see everything at once. I honestly think they're one of those tools that seems boring but actually saves you tons of headaches later.
Build the big picture first, then get into the weedy details later. Swimlanes are honestly a game-changer for showing which departments do what - saves you from those "wait, whose job is this?" moments. Your main chart should be the summary version, then break out the complicated stuff separately. I like color-coding things like approvals and handoffs because it makes everything way easier to scan. The 30-second rule is real though - if people can't follow your flow super quickly, you've probably overcomplicated it. Oh, and don't go crazy with details upfront. Add them where your team actually gets confused.
Don't overcomplicate the flowchart - seriously, cramming every tiny detail makes it impossible to read. Skip designing alone too because you'll miss stuff that actually matters to the people doing the work. I learned this the hard way! Walk through your chart with operators before you call it done. They always spot gaps you'd never think of. Keep your symbols consistent and decision points crystal clear. Honestly, some of the prettiest flowcharts I've seen were completely useless because they didn't match reality. Getting input from stakeholders isn't optional if you want something that actually works.
Honestly, flow charts are great for Lean stuff. They make it super easy to see where you're wasting time and resources. Just map out your whole process step by step - you'll quickly spot the bottlenecks and places where things just sit around doing nothing. That's the waste Lean wants you to cut out. I'd start with mapping what you do now, then create a "dream version" with all the junk removed. The visual part is key because sometimes you don't realize how messy your workflow actually is until you see it on paper. Perfect for finding those quick wins too.
So for validating flow charts, do process walkthroughs first - literally walk through each step with your team to catch gaps. Then compare your mapped process times with actual production data. Honestly, the floor operators are your best resource here since they deal with the real bottlenecks daily. Regular audits help too, plus cross-checking against quality control points. Oh, and update the chart whenever you find issues - keeps it actually useful instead of just decorative. Data analysis is solid but don't skip the human insight part.
Honestly, start with the basic input-process-output thing but swap out the boring generic stuff for what actually happens in your field. Like instead of just "quality testing" you'd put "FDA compliance testing" if you're in pharma, you know? The timing's gonna be completely different too, plus all the regulatory stuff. I'd probably grab some industry templates first - saves time. Then just customize based on how things really work day-to-day. Don't go crazy making it super detailed though. Your team needs to actually want to use the thing, and if it's too complicated they'll just ignore it.
Dude, flowcharts are seriously perfect for training newbies. You can show them the exact steps visually instead of dumping info on them verbally (which they'll totally forget anyway). New people finally see how their job connects to everything else. They spot decision points. Understanding what happens before and after their part becomes way clearer. When they get stuck later, it's so much easier than flipping through some boring manual. Oh, and definitely laminate copies - put them right at workstations where they'll actually get used.
Oh nice question! So with production flow charts you can track cycle times, bottlenecks, defect rates - all that good stuff. Quality checkpoints are clutch because they show exactly where things go wrong (and yeah, it's always that one annoying step everyone hates). Wait times between processes tell you a lot too. Equipment effectiveness is another big one. Honestly the visual aspect makes spotting downtime patterns way easier than staring at spreadsheets all day. I'd start with maybe 3-4 metrics that actually matter for whatever's driving you crazy right now.
Honestly, update them whenever something actually changes - don't wait for some arbitrary schedule. New equipment? Update it. Safety rules change? Same deal. I'd say check them quarterly just to stay on top of things, but really it's more about catching changes as they happen. Your team will hate you if they're following outdated charts that miss steps (been there, it sucks). Even small stuff matters - timing tweaks, different suppliers, whatever. Train everyone to speak up when processes shift. Oh, and set those calendar reminders or you'll totally forget. These charts aren't a one-and-done thing.
-
The templates are handy and I can personalize them as per my needs. Glad to be your subscriber!
-
I joined SlideTeam last month and there’s no doubt that I tend to find our bond only strengthening over time. Best place to find world-class themes, templates, and icons.