


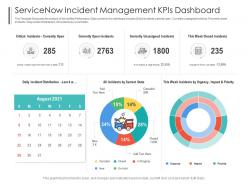
Servicenow incident management kpis dashboard snapshot powerpoint template





Try Before you Buy Download Free Sample Product
 Impress Your
 Audience
 100%
100% Editable
 Save Hours
 of Time


Our Servicenow Incident Management Kpis Dashboard Snapshot Powerpoint Template are topically designed to provide an attractive backdrop to any subject. Use them to look like a presentation pro.
People who downloaded this PowerPoint presentation also viewed the following :
Servicenow incident management kpis dashboard snapshot powerpoint template with all 2 slides:
Use our Servicenow Incident Management Kpis Dashboard Snapshot Powerpoint Template to effectively help you save your valuable time. They are readymade to fit into any presentation structure.
FAQs for Servicenow incident management kpis dashboard
So you'll want to focus on MTTR and First Call Resolution - those are your bread and butter. Customer satisfaction scores matter too, probably more than anything else if I'm being honest. Track your incident volume trends and SLA compliance percentages. Oh, and escalation rates are telling - shows how well your frontline team's handling things. Major incident frequency is huge for showing overall stability. I'd also watch the percentage of tickets resolved within target times. Start by getting baselines in ServiceNow first, then set realistic targets. Don't go crazy with improvements right away though.
Track your MTTR and break it down by priority levels - that's where you'll see what's actually happening. ServiceNow can automate those timestamps for creation, acknowledgment, and resolution, then build dashboards to spot trends. Averages lie though, so dig deeper. I always segment by incident type, team, and time of day because patterns jump out. Oh and don't forget to check variance from your SLAs consistently - that's how you catch bottlenecks before they become real problems. Use your baseline data to set realistic expectations first.
Dude, first-contact resolution is probably the best way to see if your incident team actually knows what they're doing. When tickets get fixed on the first try, users stay happy and your team isn't drowning in back-and-forth nonsense. It shows your Level 1 people have decent training and aren't just passing everything upstairs immediately. Low rates? Usually means your documentation sucks or people need more training. I've seen teams obsess over response time but honestly this matters way more. Track it monthly and shoot for like 70-80% on standard stuff.
ServiceNow already tracks this stuff automatically - just check the "Reopened" field in your reporting dashboard or build a custom report around it. High re-open rates are a red flag that your team's treating symptoms instead of actually fixing things. Your customers get frustrated, agents waste time redoing work, and honestly? Management will notice this metric because it shows whether your processes are working or not. I'd set up monthly automated reports to catch trends early. When rates jump above normal, that's when you need to dig into what's going wrong.
CSAT scores are basically your sanity check for incident management - they tell you if hitting those time targets actually means users are happy. Track them per incident or by team to spot the real wins versus just looking good on paper. Sometimes you'll crush your resolution times but users still rate you poorly, which usually means your communication sucked or they felt ignored during the process. Set up those automated surveys after closing tickets - honestly, without them you're just guessing. Create alerts when scores tank so you can figure out what went sideways before it becomes a bigger mess.
Track your MTTR and MTTA first - that's how fast your team picks up and fixes stuff. First Call Resolution is huge too since nobody wants to deal with the same issue twice. I'd also watch incident volumes, escalation rates, and those customer satisfaction surveys (even though people rarely fill them out). SLA compliance percentages matter if leadership cares about those numbers. Honestly, just set up a ServiceNow dashboard to track everything automatically. Way better than pulling reports manually every week like some masochist.
Your incident backlog basically shows you how well things are actually working when stuff hits the fan. Growing backlogs? Usually means incidents are getting messier, your team's drowning, or there's some deeper mess causing a chain reaction. Think of it like dishes piling up in the sink - something's clearly broken in your process. Honestly, I'd track those trends over time and dig into what kinds of incidents keep stacking up. A good backlog should feel predictable with decent resolution times. Once you see the patterns, you'll know if you need more people, better workflows, or if certain services are just being problematic.
Look, slow escalation times are killing your customer trust. People get pissed when they feel like they're being shuffled around or ignored - and honestly, who can blame them? Minor problems snowball into huge headaches when you don't get the right people involved quickly enough. Here's the thing though: most companies focus obsessively on resolution times but totally ignore escalation speed. Bad move. You need clear triggers for when to escalate and stick to them. Otherwise you'll have customers questioning whether you even know what you're doing. Track both metrics - they're equally important.
Look at your KPIs by individual - that's where the gaps show up clear as day. First-call resolution, escalation rates, resolution times. We had one guy who'd escalate every single network issue while his teammates handled them no problem. Dead giveaway he needed training. Customer satisfaction scores tell the story too, honestly they're sometimes more revealing than the technical metrics. Pull monthly reports and hunt for the outliers - someone's always struggling with something specific. Oh, and check classification accuracy if you track it. Makes it pretty obvious who needs help where.
Look, tracking change-related incidents separately is actually pretty smart. You'll see if bad changes are screwing up your overall numbers - trust me, nothing makes a good team look terrible like a botched deployment spiking your metrics. I'd focus on two things: what percentage of incidents come from changes, and how fast you fix them versus regular issues. Oh, and if that percentage keeps going up? Time to make your change approval process way stricter before everything goes to hell.
Dude, volume trends are gold for staffing decisions. You'll see exactly when to add people or cut back. Monday mornings always crazy? Schedule extra agents. Product launch coming? Prep ahead instead of panicking when everything explodes (trust me on this one). The best part? Leadership can't argue with solid data when you need more headcount. I track weekly and monthly patterns religiously - makes forecasting way easier. Oh, and shift scheduling becomes actually manageable instead of just guessing. Sounds boring but it literally saved my sanity during our last major release.
Honestly, the hardest part is hitting that goldilocks zone with your targets. Too easy and your team gets lazy. Too aggressive? Everyone just burns out. Your incident data is probably way messier than you realize - mine was a complete disaster when I first looked at it. External stuff will mess with your numbers constantly. Vendor outages, system upgrades, random fires you can't control. Also, different incident types need totally different expectations. A database going down isn't the same as some tiny UI bug. I'd grab at least 3-6 months of decent data before committing to anything concrete.
Set up monthly reviews to track your key metrics - MTTR, first-call resolution, escalation rates, that kind of stuff. The real work starts when numbers drop and you need to figure out why. Maybe your knowledge base is garbage or tickets keep getting sent to the wrong team. I've seen that mess up workflows more times than I can count. Use what you find to fix training gaps or automate the boring repetitive tasks. Share the insights with your team too - people work better when they actually understand how their daily work connects to the bigger goals.
For ServiceNow incident KPIs, I'd definitely go with Performance Analytics first. It's got pre-built dashboards for resolution times, SLA stuff, volume trends - all the usual suspects. Custom reports through the reporting module work too if you need something specific. Dashboards are solid for real-time monitoring (though honestly, sometimes I think execs just like the pretty colors). You could also look into Visual Task Boards or hook up external BI tools, but that's probably overkill to start. Performance Analytics will get you going fast without much hassle.
So instead of just obsessing over resolution times, try using a balanced scorecard - it covers four areas that actually matter. Track your costs per incident, customer satisfaction scores, first-call resolution rates, and how well your team's developing their skills. Way better than staring at those boring SLA dashboards honestly. The thing is, you might be hitting your time goals but completely burning out your staff or pissing off customers with terrible communication. Pick maybe 2-3 metrics from each area and check them monthly. You'll get a much clearer picture of what's really happening with your incidents.
-
Informative design.
-
Excellent work done on template design and graphics.
-
Excellent products for quick understanding.
-
It saves your time and decrease your efforts in half.