Six months roadmap for research analyst career path
A cohesive work plan is essential for achieving the desired target. Communicate your vision and lay a firm ground in front of your audience with our PowerPoint layout. Align your project milestones, budgets, deliverables, deadlines, and all the requisite information for a dynamic presentation by employing this amazingly designed Six Months Roadmap For Research Analyst Career Path. Maximize team efficiency and streamline a work plan efficiently by introducing our ready made roadmap PowerPoint theme. You can quickly establish coordination between different activities across the organization and present an insight to your colleagues by utilizing this useful business tool. Color code specific tasks, prioritize, and keep a close eye on the deadlines with the help of our eye catchy PowerPoint template. Download our Six Months Roadmap For Research Analyst Career Path for excelling at productive management.
A cohesive work plan is essential for achieving the desired target. Communicate your vision and lay a firm ground in front ..
- Google Slides is a new FREE Presentation software from Google.
- All our content is 100% compatible with Google Slides.
- Just download our designs, and upload them to Google Slides and they will work automatically.
- Amaze your audience with SlideTeam and Google Slides.
-
Want Changes to This PPT Slide? Check out our Presentation Design Services
- WideScreen Aspect ratio is becoming a very popular format. When you download this product, the downloaded ZIP will contain this product in both standard and widescreen format.
-

- Some older products that we have may only be in standard format, but they can easily be converted to widescreen.
- To do this, please open the SlideTeam product in Powerpoint, and go to
- Design ( On the top bar) -> Page Setup -> and select "On-screen Show (16:9)” in the drop down for "Slides Sized for".
- The slide or theme will change to widescreen, and all graphics will adjust automatically. You can similarly convert our content to any other desired screen aspect ratio.
Compatible With Google Slides

Get This In WideScreen
You must be logged in to download this presentation.
PowerPoint presentation slides
Presenting Six Months Roadmap For Research Analyst Career Path PowerPoint slide which is percent editable. You can change the color, font size, font type, and shapes of this PPT layout according to your needs. This PPT template is compatible with Google Slides and is available in both 4,3 and 16,9 aspect ratios. This ready to use PowerPoint presentation can be downloaded in various formats like PDF, JPG, and PNG.
People who downloaded this PowerPoint presentation also viewed the following :
Content of this Powerpoint Presentation
Description:
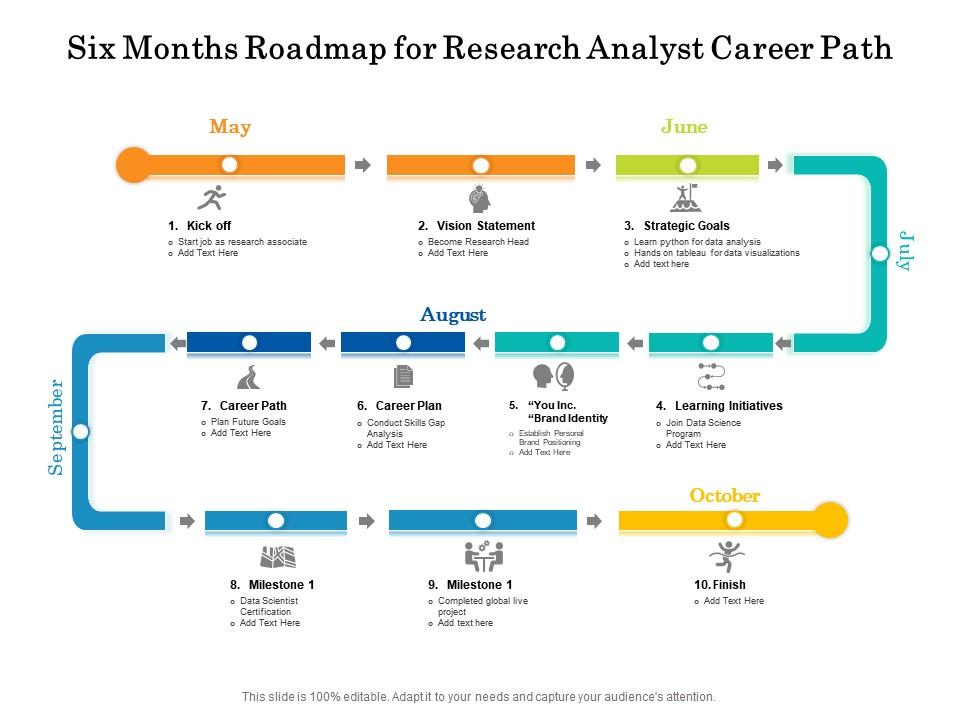
The image presented is a visual representation of a six-month roadmap specifically designed for an individual starting a career as a research analyst. The roadmap is organized in a timeline format, starting from May and ending in October, with each month having specific milestones and activities.
1. May is the "kick-off" phase, involving the start of a job as a research associate and provides space to add more text or details.
2. June focuses on crafting a vision statement to become a research head, and it also includes a provision for additional information.
3. The month of July is dedicated to setting strategic goals such as a hands-on table for data analysis and a focus on data visualization techniques, with extra space for more information if needed.
4. In August, the roadmap encouraged the individual to define a "You Inc. Brand Identity," enhancing personal brand positioning. The same month also suggests initiating learning initiatives, like joining a data science program.
5. September instructs the individual to chalk out a concrete career plan, including conducting a skills gap analysis, with extra space for additional text.
Career path planning is slated for September, focusing on planning future goals.
The roadmap ends with October aligning the final milestone to completing a global live project and attaining data scientist certification, with space to elaborate further.
Use Cases:
This structured timeline can be applied to several industries for guiding new entrants or aligning staff development plans.
1. Higher Education:
Use: Professional development for research staff
Presenter: Career services advisor
Audience: Graduate students and research associates
2. Corporate Training:
Use: Employee onboarding and career progression planning
Presenter: HR professional or personnel development manager
Audience: New hires or current employees in analyst roles
3. Professional Development Consultancies:
Use: Individual career coaching and personal branding
Presenter: Career coach or personal brand strategist
Audience: Professionals seeking career advancement
4. Non-Profit Research Organizations:
Use: Volunteer or staff development and goal setting
Presenter: Program manager or team leader
Audience: Research volunteers or non-profit staff
5. Government Agencies:
Use: Public sector employee development programs
Presenter: Department head or training coordinator
Audience: Government researchers or analysts
6. Financial Services:
Use: Career pathway planning for financial analysts
Presenter: Senior analyst or department manager
Audience: Junior analysts or associates
7. Technology Firms:
Use: Skill development and career tracking for data scientists
Presenter: Data science team lead or HR manager
Audience: Entry-level data scientists or tech associates
Six months roadmap for research analyst career path with all 2 slides:
Use our Six Months Roadmap For Research Analyst Career Path to effectively help you save your valuable time. They are readymade to fit into any presentation structure.
-
Easy to edit slides with easy to understand instructions.
-
Unique and attractive product design.
-
Perfect template with attractive color combination.
-
Great designs, really helpful.


