

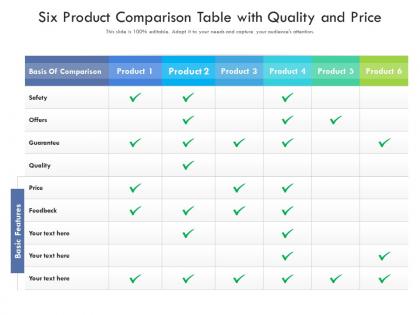
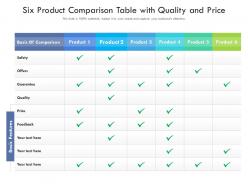
Six product comparison table with quality and price




Try Before you Buy Download Free Sample Product
 Impress Your
 Audience
 100%
100% Editable
 Save Hours
 of Time


Our Six Product Comparison Table With Quality And Price are topically designed to provide an attractive backdrop to any subject. Use them to look like a presentation pro.
People who downloaded this PowerPoint presentation also viewed the following :
Six product comparison table with quality and price with all 2 slides:
Use our Six Product Comparison Table With Quality And Price to effectively help you save your valuable time. They are readymade to fit into any presentation structure.
FAQs for Six product comparison table with
A product comparison table should include product names, pricing tiers, core features, technical specifications, customer ratings, and availability status. These elements enable customers to evaluate options systematically by highlighting unique value propositions, performance differences, and cost considerations, ultimately streamlining decision-making processes and enhancing user experiences across retail platforms.
Visual elements enhance product comparison tables through strategic use of color coding, clear typography, intuitive icons, consistent spacing, and alternating row backgrounds to guide reader focus. These design choices streamline information processing by highlighting key differences, reducing cognitive load, and enabling faster decision-making, with many organizations finding that well-designed comparison tables significantly improve user engagement and conversion rates.
Best practices for organizing products in comparison tables include grouping similar features, prioritizing key differentiators first, using consistent measurement units, highlighting standout capabilities, and arranging products from basic to premium tiers. This strategic organization streamlines evaluation by enabling quick feature scanning and direct benefit comparison, with many businesses finding that logical categorization and visual hierarchy ultimately accelerate customer decision-making and reduce purchase hesitation.
User reviews integrate into product comparison tables through aggregate ratings, sentiment analysis summaries, highlighted key feedback themes, and review count displays alongside technical specifications. This strategic combination enables customers to evaluate both objective features and real-world user experiences simultaneously, with many e-commerce platforms finding that review-enhanced comparison tables significantly increase purchase confidence and reduce return rates.
Ratings and scores serve as critical trust signals and decision shortcuts, with customers often gravitating toward higher-rated options to minimize purchase risk and cognitive load. These numerical indicators streamline the evaluation process by providing social proof and perceived quality benchmarks, ultimately accelerating purchase decisions while reducing buyer hesitation across various product categories.
Mobile responsiveness in product comparison tables can be ensured through responsive design frameworks, collapsible columns, horizontal scrolling, stackable layouts, and touch-friendly interfaces. These approaches streamline user experiences by adapting table structures to smaller screens, prioritizing essential product information, and enabling intuitive navigation, with many e-commerce platforms finding that mobile-optimized comparison tools significantly increase conversion rates and customer engagement.
Products with multiple features, specifications, or pricing tiers benefit most from comparison tables, including software solutions, electronic devices, service plans, insurance policies, and subscription offerings. These products require detailed evaluation across various criteria, and comparison tables streamline the decision-making process by presenting complex information clearly, ultimately reducing customer confusion while accelerating purchase decisions and enhancing user experience.
Product comparison tables can be designed for different personas by incorporating persona-specific feature priorities, customizable filtering options, relevant use case scenarios, and tailored messaging that speaks to each segment's unique decision-making criteria. By highlighting different value propositions, price sensitivity factors, and technical versus benefit-focused content, businesses enable more targeted customer experiences, ultimately streamlining the purchase decision process and increasing conversion rates across diverse customer segments.
When drafting comparison tables for tech gadgets, prioritize performance specifications, battery life, build quality, price points, and user experience ratings. These criteria enable consumers to evaluate devices across essential functionality areas, with many retailers and review platforms finding that comprehensive comparisons featuring real-world testing data, compatibility details, and value propositions ultimately streamline purchase decisions while enhancing customer satisfaction.
Including pricing in product comparison tables significantly influences consumer perception by establishing value expectations, enabling immediate cost-benefit analysis, and creating transparent competitive positioning across different price segments. Research shows that strategic pricing display helps consumers anchor their decision-making process, with many retail and technology companies finding that clear pricing transparency ultimately builds trust and accelerates purchase decisions.
**INPUT**: What data visualization techniques can be employed to enhance product comparison tables? **OUTPUT**: Data visualization techniques for product comparison tables include color-coded matrices, interactive filters, progress bars for ratings, heat maps for pricing, and conditional formatting for feature availability. These approaches streamline decision-making by highlighting key differentiators, enabling quick visual scanning, and providing intuitive comparisons, with many retailers and B2B platforms finding that enhanced visualizations significantly reduce customer research time while improving conversion rates. **Word count: 60 words**
SEO optimization for product comparison webpages involves strategic keyword placement in table headers, product descriptions, and meta tags, while ensuring fast loading speeds and mobile responsiveness. Through structured data markup, clear navigation paths, and comprehensive product information, businesses enhance search visibility and user experience, with many e-commerce sites finding that well-optimized comparison tables significantly increase organic traffic and conversion rates.
Product comparison tables can oversimplify complex decisions, create feature bias over actual needs, become quickly outdated, and may not reflect real-world performance differences. While these tables streamline decision-making processes, organizations often find that subjective factors like user experience, customer support quality, and integration challenges aren't captured, potentially leading to suboptimal choices despite thorough comparisons.
Competitor comparison tables significantly enhance brand trust by demonstrating transparency and confidence in product superiority, while influencing consumer behavior through simplified decision-making processes. When executed fairly and accurately, these tables reduce purchase hesitation and accelerate buying decisions, with many businesses finding that honest comparisons ultimately strengthen customer relationships and competitive positioning in increasingly crowded markets.
Tools for creating dynamic product comparison tables include Airtable, Notion, Google Sheets, Tableau, and specialized plugins like TablePress for WordPress. These platforms streamline data management by enabling real-time updates, automated sorting, and interactive filtering, with many e-commerce businesses finding that dynamic tables significantly enhance customer decision-making and reduce purchase hesitation.
-
Excellent template with unique design.
-
Perfect template with attractive color combination.
-
Awesome presentation, really professional and easy to edit.
-
The content is very helpful from business point of view.
-
Unique research projects to present in meeting.