


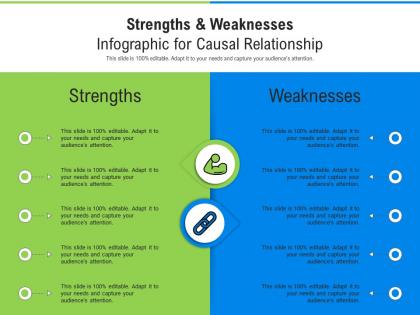
Strengths and weaknesses for causal relationship infographic template




Try Before you Buy Download Free Sample Product
 Impress Your
 Audience
 100%
100% Editable
 Save Hours
 of Time


Our Strengths And Weaknesses For Causal Relationship Infographic Template are topically designed to provide an attractive backdrop to any subject. Use them to look like a presentation pro.
People who downloaded this PowerPoint presentation also viewed the following :
Strengths and weaknesses for causal relationship infographic template with all 2 slides:
Use our Strengths And Weaknesses For Causal Relationship Infographic Template to effectively help you save your valuable time. They are readymade to fit into any presentation structure.

FAQs for Strengths and weaknesses for causal
So correlation is just when two things happen to move together - like when one goes up, the other does too (or goes down). But causation? That's when one thing actually *makes* the other happen. Perfect example: ice cream sales and drowning deaths both spike in summer, so they're correlated. Obviously ice cream isn't killing people though lol. Hot weather causes both. That's the thing - there's usually some third factor lurking around. You need actual experiments to prove something causes something else. I learned this the hard way in stats class. Don't just assume causation from your data!
So basically you want to mess with just one thing at a time - that's your independent variable. Keep everything else the same though, which is honestly harder than it sounds. Random assignment is clutch because it stops other stuff from screwing up your results. Oh and definitely have a control group to compare against. The whole point is isolation - only change what you're actually testing. Way better than just looking at correlations in data that already exists. Figure out exactly what you're changing and what you're measuring first, then build your experiment around that.
Oh this one trips people up all the time! So reverse causality is when you mix up cause and effect - like thinking more employees leads to higher revenue, when really it's the other way around. Companies with more money can afford to hire more people. Classic mistake honestly. You gotta flip your thinking and ask: wait, could my "outcome" actually be causing what I thought was the cause? Natural experiments can help sort this mess out, or instrumental variables if you're feeling fancy. It's basically the research version of "which came first, chicken or egg?"
So time series analysis is actually pretty cool for spotting causal relationships - you're looking at how variables change over time and whether one consistently leads the other. Granger causality tests are your friend here. They check if past values of variable A help predict variable B better than B can predict itself. Cross-correlation functions show timing relationships too, which is clutch for understanding delays between cause and effect. I mean, correlation still isn't causation obviously, but at least temporal ordering gives you way stronger evidence than static snapshots. Just start by plotting everything over time first - you'll often spot obvious lead-lag patterns before running any formal tests.
Ugh, the classic mistake is thinking correlation = causation just because two things happen together. Watch out for hidden variables messing with both sides - makes fake relationships look real. Your sample might be totally unrepresentative too (selection bias is such a pain). Oh, and sometimes what you think is the "effect" might actually be causing the "cause" - reverse causation will mess you up. Random experiments help if you can swing it, but honestly? Just question everything and brainstorm other explanations that could fit.
Ugh, confounding variables are the worst. They sneak in and influence both your cause AND effect, making you think A causes B when really some hidden factor C is behind everything. Classic correlation vs causation mess. You've gotta spot these sneaky variables early and deal with them through good study design or randomization. Statistical stuff like regression helps too. My prof always said it's like detective work - you're hunting for the real culprit. Without controlling for confounders, you're basically just making educated guesses instead of proving actual causation.
So basically, you can't claim something caused something else if it happened AFTER the effect - that's just backwards logic, right? The cause has to come first in the timeline. Like, you need solid proof that X actually happened before Y did. Otherwise you're just looking at correlation, which honestly gets people in trouble all the time in research. I always tell people to map out their timeline first when they're designing studies. Sounds super obvious but you'd be surprised how many researchers mess this up! It'll prevent you from making those embarrassing causal claims that don't actually hold water.
Honestly, causal diagrams are like having x-ray vision for your data. Instead of just staring at correlations wondering what's actually going on, you can map out the real pathways between variables. They're clutch for spotting confounders that'll mess up your whole analysis—plus you can see which variables actually matter to control for. The mediator thing is cool too since it shows *how* effects happen, not just that they do. I probably sound like a total nerd but they've saved me from so many "oops, correlation isn't causation" mistakes. Sketch one out before your next study. Trust me.
So basically, RCTs are the gold standard because of random assignment - you flip a coin (metaphorically) to decide who gets the treatment vs control. Any outcome differences? That's your intervention working. Random assignment controls for all the messy confounding variables, both the ones you know about and the sneaky ones you don't. Unlike observational studies where you're just watching stuff happen, RCTs actually let you say "this caused that" with confidence. Honestly, they're way more work but worth it. Always check if you can do an RCT before settling for weaker study designs.
Okay so you've got a few solid routes here. Instrumental variables work when you find something that affects the treatment but doesn't directly mess with your outcome. If there's some random cutoff in your data - like age limits or test scores - regression discontinuity is pretty sweet. Difference-in-differences is perfect for policy stuff since you're comparing groups before and after. Propensity score matching basically tries to fake randomization by pairing similar cases. I'm probably forgetting one or two methods but whatever. Each has assumptions that'll bite you if you're not careful. I'd honestly just draw out your causal graph first, then figure out which method actually fits your setup.
So ML is actually pretty good at spotting causal relationships in messy data - way better than old-school stats sometimes. You can use it to control for confounding variables and estimate treatment effects. There's this fancy stuff called causal forests and double machine learning that works great with high-dimensional data. But here's the thing - it won't magically make correlation equal causation. That's still on you. Start with a clear causal question first, then pick your ML approach. Oh, and honestly? The newer causal discovery algorithms are getting scary good at finding hidden structures in data.
Basically, bigger samples = way more confidence in your results. Small studies? You'll miss real effects or get tricked by random noise that just looks causal. Your confidence intervals get crazy wide too, so good luck figuring out the actual effect size. Honestly drives me nuts when researchers make these huge claims from like 20 participants lol. Here's the thing - larger samples help you spot genuine causal stuff versus just statistical coincidences. So yeah, always check if your sample's actually big enough to catch what you're hunting for before making any conclusions.
So mediation shows you *how* X affects Y - like exercise boosting mood because it improves sleep quality. Moderation is different - it's about *when* relationships happen. Caffeine hits harder in the morning than late at night, right? That's moderation in action. Honestly, these two concepts completely changed how I think about research. You're not stuck with basic "A causes B" anymore. My advice? Map out your suspected mediators and moderators first before jumping into stats. Trust me, it'll save you from banging your head against the wall later.
Honestly, the trickiest part is withholding treatments from control groups - feels pretty brutal when real lives are at stake. Getting proper informed consent is tricky too since most people can't really wrap their heads around complex study designs. Selection bias is another headache - you might accidentally exclude the exact vulnerable groups who need help most. Oh, and privacy gets messy fast when you're tracking people's behavior over months or years. My take? Get your ethics board involved super early. They'll help you build in protections that won't totally mess up your results but keep people safe.
So Bayesian networks are basically graphs with arrows that show how variables affect each other - causes pointing to effects. The cool thing is you can actually separate correlation from causation, which honestly feels like magic sometimes. You encode your assumptions about what causes what, then run interventions and counterfactuals through it. Structure matters though - where you put those arrows makes or breaks everything. I'd say start simple with your specific problem and check if the conditional independence stuff actually makes sense. Don't overthink it at first, just see if it feels right for your domain.
-
Commendable slides with attractive designs. Extremely pleased with the fact that they are easy to modify. Great work!
-
Nice and innovative design.
-
Awesome presentation, really professional and easy to edit.
-
Excellent Designs.
-
Great designs, Easily Editable.
-
Use of different colors is good. It's simple and attractive.