

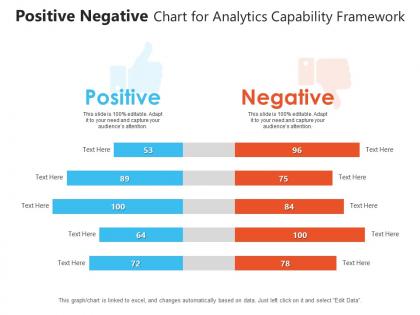
Positive negative chart for analytics capability framework infographic template




Try Before you Buy Download Free Sample Product
 Impress Your
 Audience
 100%
100% Editable
 Save Hours
 of Time


This is a Positive Negative Chart For Analytics Capability Framework Infographic Template that can be used by professionals belonging to any domain. It is a powerful illustrative tool that can be deployed to showcase consumer behavior, sales reports, progress reports, IT research results, and many more. In short, this PPT layout works for every industry, irrespective of its operations. The combination of compelling information and visual content added in this template makes it a very resourceful layout to grab. Utilize it to present information and insightful details about your business or the finished product that can be visualized from the onset. This PPT design features high quality elements like graphics, icons, etc. that can be used to further enhance the illustrative properties of a presentation. It can also be reproduced as PNG, JPG and PDF, for the users convenience.
People who downloaded this PowerPoint presentation also viewed the following :
Positive negative chart for analytics capability framework infographic template with all 2 slides:
Use our Positive Negative Chart For Analytics Capability Framework Infographic Template to effectively help you save your valuable time. They are readymade to fit into any presentation structure.
FAQs for Positive negative chart for analytics capability
So you'll need solid data infrastructure first - that's your foundation. Then grab some good analytical tools and make sure you've got people who actually know how to use them. Governance processes are huge too, plus you need a culture where people actually listen to what the data tells them (this is harder than it sounds, trust me). Don't skip the business strategy alignment part either. I've watched companies build these beautiful frameworks that completely missed the point of what they were trying to accomplish. Also set up ways to measure if your analytics are even working. Everything has to connect together or you're just wasting time.
Think of it as your game plan for actually using data instead of just staring at charts all day. It breaks down analytics into different levels - basic reports, trends, predictions, whatever your company needs. You figure out where you're at now, then see what's missing. Honestly, most places are drowning in data but starving for insights. The whole point is connecting your analytics to real business decisions, not just making fancy visualizations that collect dust. Start with a quick audit of what you've got, then focus on the capabilities that'll move the needle on stuff your leadership actually cares about.
Honestly, just pick a maturity framework like TDWI or Gartner's and run with it. They break down benchmarks for data quality, governance, skills - all that stuff. Self-assessment surveys are way less scary than hiring consultants (and cheaper too). Look at your current tools and processes, then do a gap analysis against where you actually want to be. Oh, and here's the thing - most companies start these assessments but never do anything with the results. Don't be those people. Pick one approach and actually act on what you find. Otherwise you're just making fancy spreadsheets for no reason.
Honestly, data governance is like the foundation of your whole analytics setup. Skip it and you're building on quicksand - seen that trainwreck too many times. You need someone owning the data, quality standards that actually work, and controls on who can access what. Otherwise your analytics team is just making pretty charts from garbage data. The management side keeps everything flowing smoothly between systems, while governance sets the rules for sharing and protecting stuff. I know it sounds boring, but trust me - fix this upfront or you'll spend forever putting out fires later.
Look, first figure out what business problems you're actually trying to solve - don't just jump into predictive analytics because it sounds cool. Pick one area where you've got decent historical data already, like customer churn or sales forecasting. Most companies I've seen try to tackle everything at once and it's a disaster. Build a small team with both data people and business folks who actually understand the problem. Nail one high-impact project first, show it's making money, then expand from there. Trust me, starting small saves you tons of headaches later.
Honestly, data analysts are your backbone here - they'll handle all the number crunching. Get someone solid in project management too, otherwise things just spiral. The tricky part? Finding people who can translate analytics into actual business moves, not just fancy charts nobody looks at. Communication matters way more than you'd think since explaining this stuff to executives is... well, good luck with that. Oh, and definitely need someone with change management experience because people hate new processes. I'd map out your current team's skills first, then figure out what's missing.
So every industry basically grabs the same Analytics Capability Framework but tweaks what they care about most. Healthcare goes nuts on data governance and privacy stuff - makes total sense with all those regulations. Retail's all about real-time customer analytics and personalization. Manufacturing? They're obsessed with operational analytics and predictive maintenance because nobody wants million-dollar equipment breaking down unexpectedly. Financial services pump up their risk analytics and regulatory reporting like crazy. You don't have to start from scratch though - just figure out what's absolutely critical for your industry and weight those areas heavier when you're building your roadmap.
So for data stuff, I'd go with AWS or Azure for the cloud computing part - they scale really well. Python's your best bet for analytics, though R works too if that's what your team knows. Tableau and Power BI are solid for making pretty charts that executives actually understand (trust me on this one). Pipeline management? Airflow or dbt will save your sanity. ML platforms are worth considering if you're doing prediction work. But honestly, don't get caught up in the latest shiny tools. Pick maybe 2-3 things that play nice together and actually learn them properly first. What's your team comfortable with right now?
Honestly, it's a game-changer for getting your models actually deployed instead of just sitting in notebooks forever. You get this whole structured approach covering validation, infrastructure setup, monitoring - all that stuff you'd otherwise figure out as you go. Their templates and checklists are clutch, saves you from reinventing the wheel every time. Plus it helps you nail down proper MLOps practices and automated testing pipelines. Version control becomes way less of a headache too. I'd start with their deployment readiness checklist - it'll show you exactly what's missing in your current setup. Trust me on this one.
Track both the business stuff and the behind-the-scenes metrics. Revenue gains from data decisions, cost savings, faster insights - that's your outcome side. Then measure data quality, model accuracy, how much people actually use your tools. Oh and stakeholder surveys are clutch, even though they seem basic. Honestly, avoid the fluff metrics like "dashboards built" - who cares if they're just sitting there unused? Start with maybe 4 solid metrics. You can always add more once you get the hang of what actually matters for your team.
Start with getting your executives hooked on data first - when the boss is actually checking dashboards instead of winging it, that behavior spreads fast. Then build the basics: train people so they're not afraid of numbers, give them tools they can actually use, and set up governance so the data isn't garbage. Honestly, the workflow integration part is huge - don't make it some separate "analytics thing." Pick one team, get them a quick win, then expand from there. Oh and data literacy training sounds boring but it's clutch for getting people comfortable.
Honestly, the worst part is always people being weird about changing how they do things. Can't really blame them though - who wants extra work learning new stuff? Data silos are brutal too since every department hoards their info. You'll also deal with executives not caring enough to actually fund training, plus some teams are way better with analytics than others. Oh, and data quality is usually trash everywhere. My advice? Find the biggest complainers first and make them feel involved in planning everything. Works better than fighting them later.
So basically you just connect your data stuff to what your company actually wants to accomplish. Pick your top 3 business goals first - maybe it's growing revenue or keeping customers around longer. Then figure out what analytics you'd need to make those happen. Like if you're trying to break into new markets, you'd build the right data tools to support that. Way better than just collecting random data and hoping it's useful later (which honestly most companies do). Once you work backwards from your goals, it makes way more sense. Pretty simple concept but super effective.
First thing - figure out what your team actually doesn't know through some kind of assessment. Then build training around your real business data instead of boring generic examples. People pick things up way faster when it's stuff they recognize. Pair up formal training with mentoring, though honestly the peer learning usually works better than sitting in a classroom. Don't just train your analysts either - your managers need to understand this stuff well enough to ask decent questions. Oh, and set up regular practice time where people can mess around with new tools without any pressure. That experimental time is clutch.
Look, most small businesses just throw money at random analytics tools and pray something sticks. Bad move. An Analytics Capability Framework actually helps you figure out which data skills will impact your bottom line - whether that's keeping customers longer or not overstocking inventory. Don't make the rookie mistake of jumping straight into AI when your basic reporting is still a mess (I see this constantly). Start by honestly assessing what you can do now, then build a roadmap that tackles the fundamentals first. You'll save tons of cash and headaches.
-
Enough space for editing and adding your own content.
-
Unique research projects to present in meeting.
-
It saves your time and decrease your efforts in half.
-
Excellent work done on template design and graphics.
-
Appreciate the research and its presentable format.