


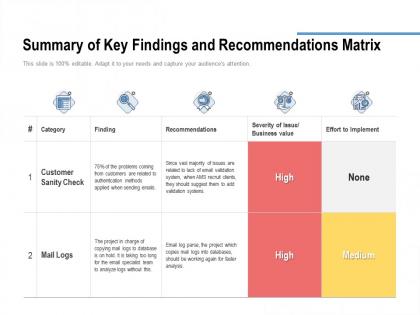
Summary of key findings and recommendations matrix




Try Before you Buy Download Free Sample Product
 Impress Your
 Audience
 100%
100% Editable
 Save Hours
 of Time


Our Summary Of Key Findings And Recommendations Matrix are explicit and effective. They combine clarity and concise expression.
People who downloaded this PowerPoint presentation also viewed the following :
Summary of key findings and recommendations matrix with all 2 slides:
Give your audience a fulfilling experience. They will find our Summary Of Key Findings And Recommendations Matrix elevating.


FAQs for Summary of key findings
So matrices have three main parts you gotta know. First are the **elements** - just the actual numbers or variables sitting inside. Then there's **dimensions**, which is rows × columns telling you the size. And **position notation** is how you find specific spots using subscripts like a₁₂. Honestly, dimensions are where most people mess up matrix multiplication - I swear it happens every time. The elements are your data, position notation helps you locate stuff (first number = row, second = column). Pro tip: always jot down dimensions before you start. Trust me on this one, it'll save you so much frustration later when things don't line up right.
So you basically turn your equations into matrix form - write it as Ax = b where A has your coefficients, x is your variables, and b is your constants. Way easier than substitution once you figure it out, trust me. Row reduction is probably the most straightforward method, though you can also find the inverse of A if it exists (which honestly gets messy fast). I'd start with like a 2x2 system first. The whole thing just makes solving systems so much cleaner - no more juggling a bunch of equations and getting lost in the algebra.
Dude, matrices are literally everywhere once you get into data science. Linear regression? Matrices. Neural networks? Matrices. Even when Netflix figures out what show to recommend you - yep, more matrices. Images are probably the easiest example since they're just grids of pixel values. Oh, and any time you're doing PCA or working with text data, you're converting everything into matrix form anyway. I swear once this clicks for you, all the ML math suddenly makes way more sense. Just start viewing your datasets as matrices right from the beginning and you'll save yourself so much confusion later.
So basically, matrix transformations let you mess with shapes in really predictable ways. You multiply the shape's coordinates by different matrices to rotate, scale, stretch, or flip things around. Like if you use a scaling matrix with [2,3] on the diagonal, it'll make your shape twice as wide and three times as tall. The cool part is every single point gets transformed at once, so the shape keeps its proportions. I honestly didn't get it until I actually drew a square and tried different matrices on it - then it clicked. You should definitely try that with some basic shapes first.
Matrices are literally everywhere in computer graphics. When you rotate, scale, or move stuff in 3D? That's all matrix multiplication happening behind the scenes. The projection matrix converts your 3D world to what you actually see on your 2D screen. Animation works the same way - those smooth transitions between keyframes get calculated using transformation matrices. Oh, and lighting calculations use them too. Honestly, if you're planning to do any graphics programming, you should definitely get comfortable with matrix math first. It'll save you so much confusion later when you're working with game engines or whatever. Trust me on this one.
So basically it's all about the shape. Row matrices are just one horizontal line of numbers [1 2 3]. Column matrices stack vertically - same info, different direction. Square ones? Equal sides, like 3×3 or 4×4. Honestly the shape tells you everything you need to know about what you can do with them. Row matrices work great for single observations or basic vectors. Columns are perfect when you're organizing variables in datasets (which happens a lot). Square matrices though - that's where the real action is. Most transformations and linear algebra stuff needs those equal dimensions to actually work properly. Start by just looking at the dimensions first, trust me.
So eigenvalues and eigenvectors are like the "special directions" a matrix cares about. Multiply a matrix by its eigenvector and you just get that same vector scaled by the eigenvalue - pretty neat actually. They're super useful for understanding how transformations work and solving differential equations. PCA uses them a ton for data stuff too. I swear once you learn about them, you start seeing them everywhere. Oh, and if you ever need to diagonalize matrices (which comes up more than you'd think), you'll definitely want to get comfortable with these first. Matrix theory basically revolves around them.
Okay so matrices are basically how ML handles data efficiently - you've got rows for samples, columns for features. Instead of looping through each data point (which is painfully slow btw), your algorithms can do linear algebra operations on whole chunks at once. Think calculating weights, transformations, optimizing parameters - all in one go. NumPy and other libraries have this stuff super optimized, plus you can use GPU acceleration. Honestly, once you start thinking in matrix operations from day one, your code becomes way faster and scales better. Trust me on this one.
So matrix rank is basically how many linearly independent rows or columns you've got. It tells you the real "dimension" of what you're dealing with. Here's why it matters - it determines if your system of equations will have one solution, infinite solutions, or just completely fail on you. I always think of it as the matrix's actual information content, if that makes sense. Short version: if you need an invertible matrix but the rank is less than the size, you're screwed. Honestly, checking rank first saves you from wasting time on messy calculations later.
Ok so addition and subtraction are pretty straightforward - just add or subtract the matching spots, but the matrices have to be the same size. Multiplication though? That one's a pain at first. You take each row from the first matrix and multiply it against each column of the second one, then add up those products. The annoying part is that your first matrix's columns have to match the second matrix's rows or you're screwed. Honestly I'd start with tiny 2x2 ones until it clicks, then work your way up to bigger stuff.
Dude, the biggest myth? That matrices are just random abstract math with zero real-world use. I totally thought that too until I realized they're literally everywhere - Google's search stuff, Netflix knowing what shows you'll binge, computer graphics, all of it. People think you need to be some math wizard, but honestly most programming languages do the hard work for you. Oh and they're not just for STEM nerds either - economists and psychologists use them constantly. Just mess around with basic operations in Python or R. You'll pick it up way faster than you think.
Dude, matrices are actually pretty solid for mapping out business stuff. You can see how processes connect and where things get stuck - bottlenecks become super obvious. Resource allocation gets way easier too. I thought it was gonna be another corporate buzzword thing, but honestly? The patterns really do pop out at you visually. Plus stakeholders actually get it when you show them a matrix instead of just talking through problems. My advice - start with something you already know inside out. Just one process. You'll probably catch connections you never noticed before.
Here's the thing about matrix conditioning - it's basically how much your tiny input errors blow up in the final answer. High condition numbers are like that one friend who overreacts to everything. Your small numerical mistakes suddenly become massive problems. I learned this the hard way in grad school, honestly. Low condition numbers? You're golden - errors stay manageable. Always check that condition number first! Anything over 10^12 means you'll want regularization or a different algorithm. Otherwise you're just asking for trouble with your linear solver.
So you've got n nodes, right? Make an n×n grid. Wherever two nodes connect, drop a 1 in that spot (or the weight if it's weighted). No connection = 0. Say node 2 links to node 4 - you'd mark [2,4] with a 1. Undirected graphs are pretty cool because they're symmetric, but directed ones can be lopsided since the connections only go one way. Just list out your nodes first, then go through each pair checking if they're connected. Takes forever by hand but computers love this stuff.
Oh dude, matrices are literally everywhere in crypto! RSA, elliptic curves, you name it. They're perfect for key generation and encryption because of all those mathematical properties - like being invertible and having determinants. The whole thing works because linear algebra lets you build functions that are super easy to compute one way but nearly impossible to reverse without the key. Pretty clever actually. You'll definitely want to get comfortable with matrix multiplication and modular arithmetic if you're getting into this stuff. Trust me, those two concepts will pop up constantly and save you so much headache later.
No Reviews