Powerpoint Templates for Infographic Showing
Save time and engage your audience with our fully editable PowerPoint PPT Templates and Slides.
-

Infographic Showing KPIs To Track And Manage Various Projects
This slide covers an infographic showing the management of more than projects. This slide highlights the main KPIs that help track projects that work simultaneously in an organization. It includes project progress and a comparison of actual and planned hours.Introducing our Infographic Showing KPIs To Track And Manage Various Projects set of slides. The topics discussed in these slides are Resource Collection, Team Building, Planned Actual. This is an immediately available PowerPoint presentation that can be conveniently customized. Download it and convince your audience.
-

Infographic Showing Dimensions For CEO Year End Review
This slide covers different dimensions on which CEO is reviewed. The purpose of this template is to showcase the different dimensions that are measured to perform year end review for the top management. It includes leadership, planning, people management, client relations, etc.Presenting our well structured Infographic Showing Dimensions For CEO Year End Review. The topics discussed in this slide are People Management, Operations Performance, Performance Review. This is an instantly available PowerPoint presentation that can be edited conveniently. Download it right away and captivate your audience.
-
Two Point Infographic Showing Conclusion LCT SS
Introducing our Two Point Infographic Showing Conclusion LCT SS set of slides. The topics discussed in these slides are Dual Chart, Comparison Diagram, Binary Visual, Paired Graphic, Twofold Illustration. This is an immediately available PowerPoint presentation that can be conveniently customized. Download it and convince your audience.
-
Infographic showing quarterly business goal achievement
Introducing our premium set of slides with Infographic Showing Quarterly Business Goal Achievement. Ellicudate the four stages and present information using this PPT slide. This is a completely adaptable PowerPoint template design that can be used to interpret topics like Profitability, Lead Convertibility Rate, Customer Retention. So download instantly and tailor it with your information.
-
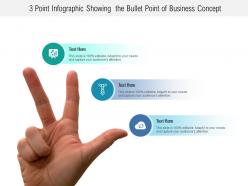
3 point infographic showing the bullet point of business concept
Presenting this set of slides with name - 3 Point Infographic Showing The Bullet Point Of Business Concept. This is a three stage process. The stages in this process are 3 Point Infographic, Business, Management.
-
Simple process in 3 point infographic showing key step
Presenting this set of slides with name - Simple Process In 3 Point Infographic Showing Key Step. This is a three stage process. The stages in this process are 3 Point Infographic, Business, Management.
-
3 point infographic showing bullet points of process step with map pin points
Presenting this set of slides with name - 3 Point Infographic Showing Bullet Points Of Process Step With Map Pin Points. This is a three stage process. The stages in this process are 3 Point Infographic, Business, Management.
-
Step down infographic showing waterfall model
Presenting this set of slides with name - Step Down Infographic Showing Waterfall Model. This is a five stage process. The stages in this process are Moving Downward, Walking Down, Walk Downstairs.
-
8 stage infographic showing phases of product development cycle
Presenting this set of slides with name - 8 Stage Infographic Showing Phases Of Product Development Cycle. This is a eight stage process. The stages in this process are Eight Stages Infographics, Management, Success.
-
3 key point infographic showing pencil target and idea bulb
Presenting this set of slides with name - 3 Key Point Infographic Showing Pencil Target And Idea Bulb. This is a three stages process. The stages in this process are 3 Key Points, 3 Key Highlights, 3 Key Stages.
-
3 point infographic showing key business highlight of any concept
Presenting this set of slides with name - 3 Point Infographic Showing Key Business Highlight Of Any Concept. This is a three stage process. The stages in this process are 3 Point Infographic, Business, Management.
-
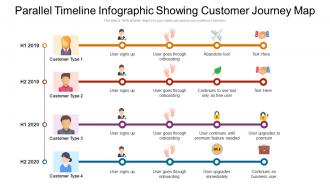
Parallel timeline infographic showing customer journey map
Presenting this set of slides with name Parallel Timeline Infographic Showing Customer Journey Map. This is a four stage process. The stages in this process are Parallel Timeline, Infographic Showing, Customer Journey Map, Abandons Tool. This is a completely editable PowerPoint presentation and is available for immediate download. Download now and impress your audience.
-
Parallel timeline infographic showing roadmap
Presenting this set of slides with name Parallel Timeline Infographic Showing Roadmap. This is a six stage process. The stages in this process are 2017 To 2020, Parallel Timeline Infographic Showing Roadmap. This is a completely editable PowerPoint presentation and is available for immediate download. Download now and impress your audience.
-
Planned vs achieved bridge infographic showing product goals
Presenting this set of slides with name Planned Vs Achieved Bridge Infographic Showing Product Goals. This is a two stage process. The stages in this process arePlanned, Actions, Achieved . This is a completely editable PowerPoint presentation and is available for immediate download. Download now and impress your audience.
-
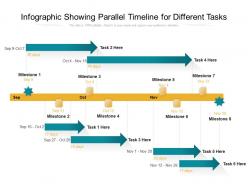
Infographic showing parallel timeline for different tasks
Presenting this set of slides with name Infographic Showing Parallel Timeline For Different Tasks. This is a eight stage process. The stages in this process are Milestone 1 to Milestone 8, Infographic Showing, Parallel Timeline, Different Tasks. This is a completely editable PowerPoint presentation and is available for immediate download. Download now and impress your audience.
-
Employee cv infographic showing skills and work experience
Introducing our premium set of slides with Employee CV Infographic Showing Skills And Work Experience. Ellicudate the one stages and present information using this PPT slide. This is a completely adaptable PowerPoint template design that can be used to interpret topics like Work Experience, Personal Profile, Achievements, Education, Organization. So download instantly and tailor it with your information.
-
Spiral Showing Side By Side Data Analysis PPT Graphics AT
Step up your game with our enchanting Spiral Showing Side By Side Data Analysis PPT Graphics AT deck, guaranteed to leave a lasting impression on your audience. Crafted with a perfect balance of simplicity, and innovation, our deck empowers you to alter it to your specific needs. You can also change the color theme of the slide to mold it to your companys specific needs. Save time with our ready made design, compatible with Microsoft versions and Google Slides. Additionally, its available for download in various formats including JPG, JPEG, and PNG. Outshine your competitors with our fully editable and customized deck.
-
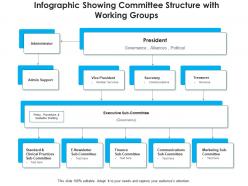
Infographic showing committee structure with working groups
Introducing our Infographic Showing Committee Structure With Working Groups set of slides. The topics discussed in these slides are Infographic, Communications, Marketing. This is an immediately available PowerPoint presentation that can be conveniently customized. Download it and convince your audience.
-
10 stage infographic showing problem solving techniques
Presenting this set of slides with name 10 Stage Infographic Showing Problem Solving Techniques. This is a ten stage process. The stages in this process are Changing Mindset, Define Problem, Measuring Results, Measuring Progress, Overcoming Obstacles, Define Idea Solution To Problem, Meeting The Deadline, Implementing The Best Solution. This is a completely editable PowerPoint presentation and is available for immediate download. Download now and impress your audience.
-
8 stage infographic showing strategy for using seo
Presenting our set of slides with 8 Stage Infographic Showing Strategy For Using SEO. This exhibits information on eight stages of the process. This is an easy-to-edit and innovatively designed PowerPoint template. So download immediately and highlight information on Performance, Target Audience, Effective Keywords, Analytics, Content.
-
Infographic showing 6 objectives of communication
Presenting our set of slides with Infographic Showing 6 Objectives Of Communication. This exhibits information on six stages of the process. This is an easy-to-edit and innovatively designed PowerPoint template. So download immediately and highlight information on Building Awareness, Creating Interest, Providing Information, Motivating Audience, Increasing Efficiency.
-
10 stage infographic showing problem solution
Presenting this set of slides with name 10 Stage Infographic Showing Problem Solution. This is a ten stage process. The stages in this process are Changing Mindset, Define Problem, Measuring Results, Measuring Progress, Overcoming Obstacles, Define Idea Solution To Problem, Meeting The Deadline, Implementing The Best Solution. This is a completely editable PowerPoint presentation and is available for immediate download. Download now and impress your audience.
-
Infographic showing big question mark forming from clouds
Presenting this set of slides with name Infographic Showing Big Question Mark Forming From Clouds. This is a one stage process. The stage in this process is Infographic Showing Big Question Mark Forming From Clouds. This is a completely editable PowerPoint presentation and is available for immediate download. Download now and impress your audience.
-
Infographic showing sales growth in percentages
Presenting this set of slides with name Infographic Showing Sales Growth In Percentages. This is a five stage process. The stages in this process are Go To Market Strategy, Talent Strategy, Infographic Showing, Sales Growth In Percentages. This is a completely editable PowerPoint presentation and is available for immediate download. Download now and impress your audience.
-
Infographic showing structure of campus planning committee
Presenting our well-structured Infographic Showing Structure Of Campus Planning Committee. The topics discussed in this slide are Infographic, Planning, Structure. This is an instantly available PowerPoint presentation that can be edited conveniently. Download it right away and captivate your audience.
-
Four segment infographic showing components of corporate social responsibility
Presenting our set of slides with name Four Segment Infographic Showing Components Of Corporate Social Responsibility. This exhibits information on four stages of the process. This is an easy to edit and innovatively designed PowerPoint template. So download immediately and highlight information on Economic Social Responsibility, Discretionary Social Responsibility, Legal Social Responsibility, Ethical Social Responsibility.
-
Infographic showing years of growth with arrow
Presenting this set of slides with name Infographic Showing Years Of Growth With Arrow. This is a four stage process. The stages in this process are North America, Organic Growth Through Partners, New Packaged Offerings. This is a completely editable PowerPoint presentation and is available for immediate download. Download now and impress your audience.
-
Lego blocks infographic showing decision making process for business
Presenting our set of slides with name Lego Blocks Infographic Showing Decision Making Process For Business. This exhibits information on five stages of the process. This is an easy-to-edit and innovatively designed PowerPoint template. So download immediately and highlight information on Infographic,Process,Business.
-
Planned vs achieved infographic roadmap showing production targets
Presenting this set of slides with name Planned Vs Achieved Infographic Roadmap Showing Production Targets. This is a two stage process. The stages in this process are Production, Efficiency, Quarter. This is a completely editable PowerPoint presentation and is available for immediate download. Download now and impress your audience.
-
Icon showing checklist infographic with detailed description
Presenting this set of slides with name Icon Showing Checklist Infographic With Detailed Description. This is a three stage process. The stages in this process are Icon Showing Checklist Infographic With Detailed Description. This is a completely editable PowerPoint presentation and is available for immediate download. Download now and impress your audience.
-
Organizational data tables for showing business insights infographic template
Deploy our Organizational Data Tables For Showing Business Insights Infographic Template to present high-quality presentations. It is designed in PowerPoint and is available for immediate download in standard and widescreen sizes. Not only this, but this layout is also 100 percent editable, giving you full control over its applications.
-
Circular Flow Diagram Showing 6 Business Phases Infographic Powerpoint Template
This slide presents a modern, circular flow diagram that outlines six interconnected business phases. Each phase is visually represented with icons and editable text blocks, flowing clockwise to depict continuity and progress. Ideal for illustrating project lifecycles, business transformation journeys, or operational frameworks, this design ensures clarity and cohesion across all phases of your strategic narrative.
-
Bar graph with percentages showing total company expenditures infographic template
This is a single slide titled Bar Graph With Percentages Showing Total Company Expenditures Infographic Template. It is crafted using high quality vector based visuals that are 100 percent editable and available for immediate download in standard and widescreen aspect ratios.
-
Essential Business Growth Statistics Revealed PPT Graphics AT
Do not compromise on a template that erodes your messages impact. Introducing our engaging Essential Business Growth Statistics Revealed PPT Graphics AT complete deck, thoughtfully crafted to grab your audiences attention instantly. With this deck, effortlessly download and adjust elements, streamlining the customization process. Whether you are using Microsoft versions or Google Slides, it fits seamlessly into your workflow. Furthermore, it is accessible in JPG, JPEG, PNG, and PDF formats, facilitating easy sharing and editing. Not only that you also play with the color theme of your slides making it suitable as per your audiences preference.
-

One page customer satisfaction dashboard showing improvement of service infographic ppt pdf document
Rules and regulations tend to differ drastically between individuals and enterprises. Getting hold of a template that perfectly fits the bill is next to impossible. Not anymore though. Our exclusive One Page Customer Satisfaction Dashboard Showing Improvement Of Service Infographic PPT PDF Document template design is suitable for every person and organization, irrespective of their beliefs and preferences. The exceptional touch and thought process that has gone behind designing this wonder template depicts in the form of its all round use. We promise you that your satisfaction levels will be next level, all thanks to our mesmerizing template.
-
Four comparison table showing monthly pricing plans infographic template
This is our Four Comparison Table Showing Monthly Pricing Plans Infographic Template designed in PowerPoint, however, you can also access it in Google Slides. It comes in two aspect ratios standard and widescreen, with fully editable visual content.
-
Pricing table showing different product specifications infographic template
This is a single slide titled Pricing Table Showing Different Product Specifications Infographic Template. It is crafted using high quality vector based visuals that are 100 percent editable and available for immediate download in standard and widescreen aspect ratios.
-
6 steps diagram showing strategic management process infographic template
This is our 6 Steps Diagram Showing Strategic Management Process Infographic Template designed in PowerPoint, however, you can also access it in Google Slides. It comes in two aspect ratios standard and widescreen, with fully editable visual content.
-
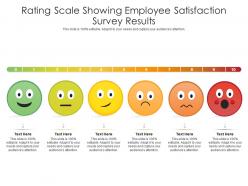
Rating scale showing employee satisfaction survey results infographic template
This is a single slide titled Rating Scale Showing Employee Satisfaction Survey Results Infographic Template. It is crafted using high quality vector based visuals that are 100 percent editable and available for immediate download in standard and widescreen aspect ratios.
-
6 process slide showing intellectual property portfolio management infographic template
Deploy our 6 Process Slide Showing Intellectual Property Portfolio Management Infographic Template to present high quality presentations. It is designed in PowerPoint and is available for immediate download in standard and widescreen sizes. Not only this, but this layout is also 100 percent editable, giving you full control over its applications.
-
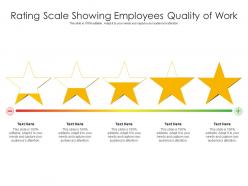
Rating scale showing employees quality of work infographic template
This is our Rating Scale Showing Employees Quality Of Work Infographic Template designed in PowerPoint, however, you can also access it in Google Slides. It comes in two aspect ratios standard and widescreen, with fully editable visual content.
-
Ef diagrams showing one to many relationships infographic template
This is our EF Diagrams Showing One To Many Relationships Infographic Template designed in PowerPoint, however, you can also access it in Google Slides. It comes in two aspect ratios standard and widescreen, with fully editable visual content.
-
Entity framework diagram showing one to many relationships infographic template
Deploy our Entity Framework Diagram Showing One To Many Relationships Infographic Template to present high quality presentations. It is designed in PowerPoint and is available for immediate download in standard and widescreen sizes. Not only this, but this layout is also 100 percent editable, giving you full control over its applications.
-
3 month roadmap stages showing executive benefits and compensation infographic template
Deploy our 3 Month Roadmap Stages Showing Executive Benefits And Compensation Infographic Template to present high quality presentations. It is designed in PowerPoint and is available for immediate download in standard and widescreen sizes. Not only this, but this layout is also 100 percent editable, giving you full control over its applications.
-

One 6 month calendar showing employee work shift presentation report infographic ppt pdf document
Here we present this One 6 Month Calendar Showing Employee Work Shift Presentation Report Infographic PPT PDF Document one pager template Help your content team stay organized and focused by downloading this amazingly designed 6 month content calendar one pager PowerPoint template. This one pager content marketing slide will help you plan strategies for content marketing. The readily available PowerPoint one pager template will give you an overview of how the content will be carried over a specified period of time. This template can be used by all the companies to devise strategies to execute the made plans. It displays the details of the product to be promoted online, and its budget. You can jot down your companys name and logo and can specify the names of the team members up for executing the project. This one pager slide lets you keep a track on your monthly progress and review your performance. Staying organized is the only key to help your business grow and this can be done utilizing this amazingly designed PowerPoint one pager slide. This one pager will save a lot of your time by being organized and using this your team will be able to plan all the content related activities. Visualize how the content is distributed throughout the year by downloading this completely editable PowerPoint one pager. Grab this One 6 Month Calendar Showing Employee Work Shit Presentation Report Infographic PPT PDF Document one pager template now.
-

One page geo tagging usa map showing covid 19 cases presentation report infographic ppt pdf document
Here we present One Page Geo Tagging USA Map Showing COVID 19 Cases Presentation Report Infographic PPT PDF Document one pager PowerPoint template. Our designers and research professionals at SlideTeam constantly work hard to suit the changing needs of our customers and provide them with the best products. This One Pager of pre developed Geo Tagging or Geotagging Map is made available to suit multiple needs of our diverse customers. This One Pager PowerPoint Template illustrates city tags on the globe depicting geotagging. This One Pager can be utilized for academic, research etc. purposes. With the assistance of our Geo Mapping One Pager you can help your readers or customers to find a wide variety of location specific information just by looking at this self explanatory One Pager world map. Moreover, this innovative One Pager sample can be optimized by companies to showcase various locations of the company or display the sales highlights on this geotagging map. This template comes with the liberty to make alterations in the text layout, graphical details, font and colors so that one can personalize it to fulfill their specific needs. Download this One Pager Geo Mapping sample and transform it into PNG, JPG, JPEG and PDF file formats. Grab this One Page Geo Tagging USA Map Showing COVID 19 Cases Presentation Report Infographic PPT PDF Document one pager template now.
-
Icon showing 14 step circular business process infographic
Presenting this set of slides with name Icon Showing 14 Step Circular Business Process Infographic. The topics discussed in these slides is Icon Showing 14 Step Circular Business Process Infographic. This is a completely editable PowerPoint presentation and is available for immediate download. Download now and impress your audience.
-
Statement showing in working capital ppt powerpoint presentation gallery infographic template
Presenting this set of slides with name - Statement Showing In Working Capital Ppt Powerpoint Presentation Gallery Infographic Template. This is a five stage process. The stages in this process are Compare, Business, Management, Marketing.
-

One page timeline showing history and milestones achieved by the firm infographic ppt pdf document
Communicating with your stakeholders on a one to one basis can become extremely challenging. Whats best is to put together a One Page Timeline Showing History And Milestones Achieved By The Firm Infographic PPT PDF Document one pager presentation and address a group in one go. This can become a success if you settle for our customized template design. By investing in our one of its kind template design you can ensure better planning, transparency, spot on feedback, improved productivity and bottom lines in the days to come. Additionally, our template bestows upon you the right to modify data and graphics to suit your individual interests and understanding. Time to get out the template right away. An investment you are going to be proud of.
-

One page user results template showing five stage ux research process report infographic ppt pdf document
Here we present One Page User Results Template Showing Five Stage UX Research Process Report Infographic PPT PDF Document one page PowerPoint template. 5 Stage UX Research Process needs to be explained in a simplified manner in order to ensure better understanding, which is now made possible by our One Page user results template showing five stage UX Research Process. By using our pre-developed PowerPoint one pager template, you will in a position to plan your activities better. Above all, you will be able to give a push to the process of problem solving and decision making. In the process, you will be able to save plenty of time and instead focus on your core activities. This user research result PowerPoint template covers the 5 stages of UX research process namely problem framing, ideation, experimentation, optimization and evaluation. You can edit both text and graphics in this template. Grab this One Page User Results Template Showing Five Stage UX Research Process Presentation Report Infographic PPT PDF Document one pager template now.
-
Manufacturing Infographic Bundle PPT Designs AT
While your presentation may contain top-notch content, if it lacks visual appeal, you are not fully engaging your audience. Introducing our Manufacturing Infographic Bundle PPT Designs AT deck, designed to engage your audience. Our complete deck boasts a seamless blend of Creativity and versatility. You can effortlessly customize elements and color schemes to align with your brand identity. Save precious time with our pre-designed template, compatible with Microsoft versions and Google Slides. Plus, its downloadable in multiple formats like JPG, JPEG, and PNG. Elevate your presentations and outshine your competitors effortlessly with our visually stunning 100 percent editable deck.
-
6 steps diagram showing pros and cons of agile product development process infographic template
This is a single slide titled 6 Steps Diagram Showing Pros And Cons Of Agile Product Development Process Infographic Template. It is crafted using high quality vector based visuals that are 100 percent editable and available for immediate download in standard and widescreen aspect ratios.
-

One page template showing why how what of user results in ux research report infographic ppt pdf document
Here we present One Page Template Showing Why How What Of User Results In UX Research Report Infographic PPT PDF Document one page PowerPoint template. 5 Stage UX Research Process needs to be explained in a simplified manner in order to ensure better understanding, which is now made possible by our One Page user results template showing five stage UX Research Process. By using our pre-developed PowerPoint one pager template, you will in a position to plan your activities better. Above all, you will be able to give a push to the process of problem solving and decision making. In the process, you will be able to save plenty of time and instead focus on your core activities. This user research result PowerPoint template covers the 5 stages of UX research process namely problem framing, ideation, experimentation, optimization and evaluation. You can edit both text and graphics in this template. Grab this One Page Template Showing Why How What Of User Results In UX Research Presentation Report Infographic PPT PDF Document one pager template now.
-

One page geo tagging map showing sales across the globe presentation report infographic ppt pdf document
Here we present Geotagging Map Showing Rise In COVID 19 Cases Presentation Report Infographic PPT PDF Document one pager PowerPoint template. Our designers and research professionals at SlideTeam constantly work hard to suit the changing needs of our customers and provide them with the best products. This One Pager of pre developed Geo Tagging or Geotagging Map is made available to suit multiple needs of our diverse customers. This One Pager PowerPoint Template illustrates city tags on the globe depicting geotagging. This One Pager can be utilized for academic, research etc. purposes. With the assistance of our Geo Mapping One Pager you can help your readers or customers to find a wide variety of location specific information just by looking at this self explanatory One Pager world map. Moreover, this innovative One Pager sample can be optimized by companies to showcase various locations of the company or display the sales highlights on this geotagging map. This template comes with the liberty to make alterations in the text layout, graphical details, font and colors so that one can personalize it to fulfill their specific needs. Download this One Pager Geo Mapping sample and transform it into PNG, JPG, JPEG and PDF file formats. Grab this Geotagging Map Showing Rise In COVID 19 Cases Presentation Report Infographic PPT PDF Document one pager template now.
-
Infrastructure kpi metrics showing cost saving it operations management ppt infographic
Increase audience engagement and knowledge by dispensing information using Infrastructure KPI Metrics Showing Cost Saving IT Operations Management Ppt Infographic. This template helps you present information on three stages. You can also present information on Percent Of Defects, Net Project Revenue Per Employee, Cost Savings using this PPT design. This layout is completely editable so personaize it now to meet your audiences expectations.
-
Visualizing Data To Uncover Insights Effectively PPT Demonstration AT
Ditch the Dull templates and opt for our engaging Visualizing Data To Uncover Insights Effectively PPT Demonstration AT deck to attract your audience. Our visually striking design effortlessly combines creativity with functionality, ensuring your content shines through. Compatible with Microsoft versions and Google Slides, it offers seamless integration of presentation. Save time and effort with our pre designed PPT layout, while still having the freedom to customize fonts, colors, and everything you ask for. With the ability to download in various formats like JPG, JPEG, and PNG, sharing your slides has never been easier. From boardroom meetings to client pitches, this deck can be the secret weapon to leaving a lasting impression.
-
Top Graphical Dashboard For Business Insights PPT Demonstration AT
While your presentation may contain top-notch content, if it lacks visual appeal, you are not fully engaging your audience. Introducing our Top Graphical Dashboard For Business Insights PPT Demonstration AT deck, designed to engage your audience. Our complete deck boasts a seamless blend of Creativity and versatility. You can effortlessly customize elements and color schemes to align with your brand identity. Save precious time with our pre-designed template, compatible with Microsoft versions and Google Slides. Plus, its downloadable in multiple formats like JPG, JPEG, and PNG. Elevate your presentations and outshine your competitors effortlessly with our visually stunning 100 percent editable deck.
-
Choosing Visualizations That Accurately Represent Your Data PPT Template AT
While your presentation may contain top-notch content, if it lacks visual appeal, you are not fully engaging your audience. Introducing our Choosing Visualizations That Accurately Represent Your Data PPT Template AT deck, designed to engage your audience. Our complete deck boasts a seamless blend of Creativity and versatility. You can effortlessly customize elements and color schemes to align with your brand identity. Save precious time with our pre-designed template, compatible with Microsoft versions and Google Slides. Plus, its downloadable in multiple formats like JPG, JPEG, and PNG. Elevate your presentations and outshine your competitors effortlessly with our visually stunning 100 percent editable deck.
-
Statistical Dashboard With Graphs Overview PPT PowerPoint AT
Do not compromise on a template that erodes your messages impact. Introducing our engaging Statistical Dashboard With Graphs Overview PPT PowerPoint AT complete deck, thoughtfully crafted to grab your audiences attention instantly. With this deck, effortlessly download and adjust elements, streamlining the customization process. Whether you are using Microsoft versions or Google Slides, it fits seamlessly into your workflow. Furthermore, it is accessible in JPG, JPEG, PNG, and PDF formats, facilitating easy sharing and editing. Not only that you also play with the color theme of your slides making it suitable as per your audiences preference.
-
Data Visualization With Graphs And Maps PPT Presentation AT
Do not compromise on a template that erodes your messages impact. Introducing our engaging Data Visualization With Graphs And Maps PPT Presentation AT complete deck, thoughtfully crafted to grab your audiences attention instantly. With this deck, effortlessly download and adjust elements, streamlining the customization process. Whether you are using Microsoft versions or Google Slides, it fits seamlessly into your workflow. Furthermore, it is accessible in JPG, JPEG, PNG, and PDF formats, facilitating easy sharing and editing. Not only that you also play with the color theme of your slides making it suitable as per your audiences preference.