


Bell curve showing iq test score range




Try Before you Buy Download Free Sample Product
 Impress Your
 Audience
 100%
100% Editable
 Save Hours
 of Time


Our Bell Curve Showing IQ Test Score Range are topically designed to provide an attractive backdrop to any subject. Use them to look like a presentation pro.
People who downloaded this PowerPoint presentation also viewed the following :
Content of this Powerpoint Presentation
Subject-matter expertise is secondary to a person's validity of their capability to do things and make their way in the world. It has always always been the IQ assessment that has mattered foremost. Be it the corporate, or government examinations, candidates are subjected to aptitude and reasoning tests to assess their cognitive abilities, abstract thinking, and problem-solving skills and attention to detail. Based on such IQ assessments, hirings, promotions, and even, dismissals are announced. However, as a pool of candidates are evaluated, a range of IQ results are filtered out because of individual capabilities and intellects. There'll be two extremes and many categories in between.
This spectrum forms the basis of varied levels of appreciation that contestants will receive.
To study and depict the ranges of IQs that identify gradings that your organization recognizes, our presentation experts have curated this bell-curve PPT Design to show those grading levels. The PPT Slide also illustrates scores of applicants who have undergone evaluation to rate their mental and cognitive faculties. Let's explore the purpose and use of this PPT Layout below:
Template 1: Bell Curve Showing IQ Test Score Range PPT Template
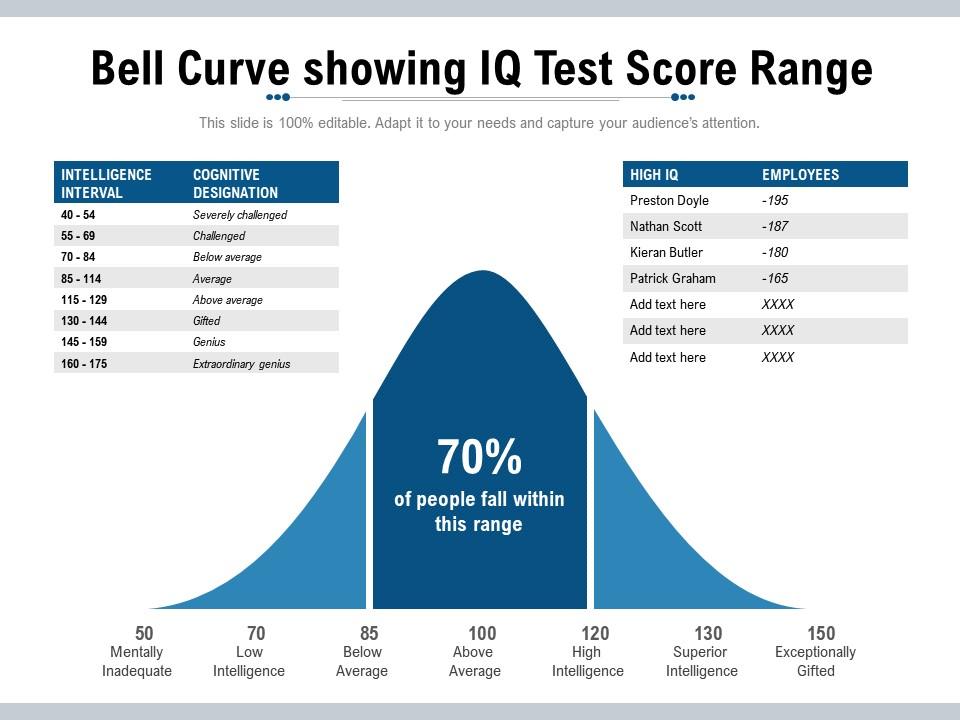
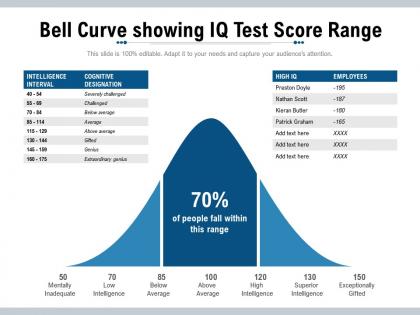
Use this PowerPoint Diagram to measure and estimate the IQ level of your interviewees. It features an Excel-linked bell curve to categorize candidates on a scale between mentally inadequate and exceptionally gifted. Other categories in between are shown as low intelligence, below average, above average, high intelligence, and superior intelligence. This intricate-spectrum will help you locate 7 categories and candidates that fall under the intervals created. Using this PPT Guide, you can further grade subjects to understand their mental views and processes.
Here's another PPT Design to examine the intellect diversity of your interviewees.
Know the Pool of Brain Power Being Examined
Grab this powerful PPT Diagram to differentiate the exceptionally gifted from the mentally inadequate and to know the ranges of brain power and competence that is linked to each.
PS: Get creative with human IQ evaluation using this bell diagram PPT Layout featuring infographics from tests and interviews of a lot of people.
Bell curve showing iq test score range with all 2 slides:
Use our Bell Curve Showing IQ Test Score Range to effectively help you save your valuable time. They are readymade to fit into any presentation structure.
FAQs for Bell curve showing iq
So IQ scores form this bell shape when you plot them out - most people land right around 100 (the average), then it drops off on both sides. Think of it like a hill, I guess? About 68% of folks score between 85-115, and 95% fall between 70-130. The crazy high or low scores are actually pretty uncommon, which makes sense when you think about it. It's literally called a bell curve because it looks like a bell when graphed. Pretty straightforward stuff, but the main thing is that most people cluster near that middle range.
So picture the bell curve - most people hang out right around that average IQ of 100. About 68% fall in the 85-115 range, which is pretty much the "normal" zone. Think of it like height, honestly - most folks aren't giants or super short, just regular. As you move toward genius level or way below average, the numbers drop off fast. That's why the curve looks so skinny at the ends. If you're working on educational stuff, you're mostly dealing with that big middle group anyway. Makes sense when you think about it.
So basically 68% of people have IQs between 85-115 (using the standard scale where 100 is average). It's that bell curve thing from stats - honestly I always mix up the percentages but that one stuck. Most people you meet fall in that range, like 2 out of 3. The other 32% split evenly - 16% above 115 and 16% below 85. Pretty straightforward math but weirdly helpful when you think about it. I remember my psych prof always bringing this up when we talked about testing stuff.
Look, the IQ curve itself doesn't really change - what shifts is where different groups land on it based on their circumstances. Poor nutrition, crappy schools, constant stress? Yeah, that's gonna tank cognitive development. Communities without resources consistently score lower, but it's not because they're inherently less capable. That's the part people always get wrong (drives me nuts honestly). The real issue is systemic barriers. Like, a kid worrying about food security isn't exactly primed for academic success, you know? Fix the environmental problems and you'll see those gaps shrink.
So basically the bell curve shows most kids score average on tests, with way fewer getting super high or super low scores. If your test results don't look like that normal distribution, then yeah - something's probably wrong with either the test itself or who took it. That's where all those percentile rankings come from (which honestly just confuse parents half the time). You should expect most students performing right at grade level. Here's the thing though - use this to keep your expectations realistic and put extra help toward the outliers who clearly need different support.
So IQ tests use a standard deviation of 15 points, which makes the math pretty straightforward. A score of 115? That's one standard deviation above 100, putting you around 84th percentile. Not bad! Two jumps up gets you to 130 - that's where they start calling people "gifted." I always thought it was cool how you can just count in 15s to figure out where someone ranks. Like, 68% of people fall within one standard deviation above or below average. Makes it super easy to eyeball any score and know roughly where they stand compared to everyone else.
Honestly, the biggest issue is that intelligence is way too messy for one number. IQ tests claim they measure "pure" smarts, but they're really testing learned stuff and cultural knowledge. Your brain doesn't work like that anyway - you might crush spatial problems but bomb verbal ones, you know? The bell curve thing oversimplifies everything. Plus these tests have serious cultural bias baked in. Some people have used this model to justify really gross discrimination too. IQ scores are just a tiny snapshot, not your whole cognitive story.
Look, the bell curve is just showing us the pattern in IQ scores - it doesn't prove anything about genes vs environment. People get all worked up interpreting what causes that shape. Some blame genetics, others point to stuff like poverty, bad schools, or cultural bias in testing. Honestly the whole debate gets pretty toxic sometimes. What you're seeing is just test results distributed in that familiar curve - could be from nature, nurture, or both. The curve itself? Totally neutral. It's when people start making claims about *why* it looks that way that things get messy.
Those IQ outliers you're thinking about - people scoring under 70 or over 130 - don't actually break the bell curve. They're sitting right where they should be in those skinny tail sections. About 2.5% of people land in each extreme, which matches what the normal distribution predicts perfectly. Sure, these cases grab all the headlines (geniuses, intellectual disabilities), but honestly? They're just proving the math works. It's kind of ironic - the most dramatic scores are actually the best evidence that the whole system is doing exactly what it's supposed to do.
So basically the bell curve shows where someone lands in the whole IQ spread. Gifted kids are usually in that top 2-3%, so we're talking IQs above 130-135. That's like maybe 2-3 kids in a classroom of 100 - honestly blew my mind when I first realized how rare it actually is. You can use this to set your screening cutoffs and figure out who's truly "gifted" versus just "bright" (they need completely different teaching approaches btw). I'd start with standardized tests and look for scores consistently hitting that 130+ mark across different measures.
Yeah so the bell curve thing is kinda flawed because it assumes everyone had the same shot at good education and opportunities - which we know isn't true. IQ tests were literally designed by specific groups for their own demographics, so there's built-in bias right there. Different cultures, languages, socioeconomic backgrounds all mess with the results. Honestly, it works better when you're looking at similar populations, but across diverse groups? It just ends up reinforcing stereotypes instead of actually measuring intelligence. You've gotta look at the context behind the numbers or they're basically meaningless.
So basically the whole IQ thing has changed a lot from what people used to think. Back in the day, researchers were convinced your IQ was just genetics - totally fixed. Turns out that's pretty wrong though. Education, what you eat, how much money your family has - all that stuff actually matters for test scores. There's this weird phenomenon called the Flynn effect where average scores keep going up like 3 points every ten years in developed countries. Nobody really expected that. The whole bell curve idea isn't as universal as they thought either, it changes depending on the group you're looking at. Honestly, it's just one way to measure how smart someone is anyway.
Ugh, so the bell curve thing gets weaponized constantly to justify inequality - like "oh well, some groups are just naturally smarter." Total BS if you ask me. People act like intelligence is one simple number you can measure, but it's way more complicated than that. IQ tests are biased toward certain cultures anyway. The whole obsession with being "above average" is kinda toxic too. Intelligence isn't even one single trait! Honestly, whenever someone starts throwing around bell curve arguments about social problems, they're probably pushing some agenda. Worth questioning what they're really trying to say.
So there's actually a bunch of different ways researchers look at IQ beyond the standard bell curve. Multi-factor models split intelligence into separate skills instead of one big score. Then you've got hierarchical ones that stack cognitive abilities in layers - kinda like building blocks. Some argue the distribution isn't even symmetrical, which creates drama in academic conferences (trust me, these debates get weird). Dynamic models are cool though - they account for how your intelligence shifts with time and situation rather than being stuck at one number. Really depends what you're studying, but don't just default to the bell curve if it doesn't fit your data.
Honestly, tech will probably mess with the IQ curve in weird ways. Better testing might show it's not even bell-shaped to begin with. Brain implants could shift everything higher - or create multiple peaks if only some people get them. We're already seeing scores rise over time with the Flynn effect, so there's that. But here's what's really wild: AI might change how we define intelligence entirely. Like, why test math skills when computers do it better? I'd focus more on staying adaptable. Who knows what we'll even be measuring in 20 years.
-
Understandable and informative presentation.