


Iq standard chart with index score and percentile rank




Try Before you Buy Download Free Sample Product
 Impress Your
 Audience
 100%
100% Editable
 Save Hours
 of Time


Our IQ Standard Chart With Index Score And Percentile Rank are topically designed to provide an attractive backdrop to any subject. Use them to look like a presentation pro.
People who downloaded this PowerPoint presentation also viewed the following :
Content of this Powerpoint Presentation
Description:
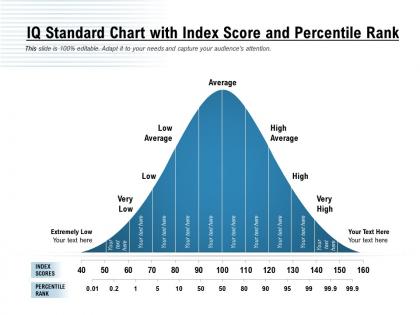
The image displays an IQ (Intelligence Quotient) Standard Chart with Index Score and Percentile Rank, typically used for illustrating the distribution of IQ scores in a population. The chart is a bell curve graph that represents the normal distribution of IQ scores, categorized into several ranges: Extremely Low, Very Low, Low, Low Average, Average, High Average, High, and Very High.
The horizontal axis of the chart shows the IQ index scores, which typically range from a score of 40 to 160. Below the IQ scores, the corresponding percentile ranks are indicated, starting from 0.01 percentile to 99.9 percentile. The percentile rank shows the percentage of scores that fall below a particular IQ score in the general population.
For instance, an IQ score of 100 is labeled as "Average" and is positioned at the peak of the bell curve, indicating that this score is at the 50th percentile, meaning it is higher than 50% of the population's IQ scores. As the curve tapers off to the left or right, representing the lower and higher extremes of IQ scores, the percentile ranks decrease and increase, respectively.
The shaded area under the curve is divided into sections with various shades of blue, each labeled with different categories of IQ scores. These categories are used to quickly identify the range in which an individual's IQ score falls.
On the left and right extremes of the bell curve, placeholders are saying "Your text here," allowing the presenter to add additional information or context to the extreme values of the chart.
Use Cases:
IQ distribution charts are utilized across various fields to analyze cognitive capabilities about normative data. Here's how different industries can use them:
1. Education:
Use: Assessing student cognitive abilities for tailored educational programs.
Presenter: Educational Psychologist.
Audience: Teachers, Special Education Coordinators.
2. Human Resources:
Use: Evaluating cognitive assessments for recruitment or development purposes.
Presenter: HR Manager.
Audience: Recruitment Team, Management.
3. Psychology and Counseling:
Use: Interpreting IQ test results for diagnostic and counseling processes.
Presenter: Clinical Psychologist.
Audience: Clients, Mental Health Professionals.
4. Research and Development:
Use: Analyzing cognitive data for psychological research studies.
Presenter: Research Scientist.
Audience: Academics, Research Participants.
5. Government Agencies:
Use: Informing policy on educational and social programs.
Presenter: Policy Analyst.
Audience: Legislators, Education Officials.
6. Healthcare:
Use: Diagnosing cognitive conditions and planning patient care.
Presenter: Neuropsychologist.
Audience: Medical Staff, Patients' Families.
7. Neuroscience:
Use: Studying brain function and intelligence correlations.
Presenter: Neuroscientist.
Audience: Fellow Scientists, Medical Students
Iq standard chart with index score and percentile rank with all 2 slides:
Use our IQ Standard Chart With Index Score And Percentile Rank to effectively help you save your valuable time. They are readymade to fit into any presentation structure.
FAQs for Iq standard chart with index score
Most IQ tests use 100 as average with a 15-point spread. So 85-115 is normal range, below 85 is considered low, and 130+ gets you into gifted territory. But here's the thing - different tests use different scales, which is honestly pretty annoying when you're trying to compare scores. The WAIS and Stanford-Binet are the big individual ones, but there's group tests too. Your score really depends on which specific test you took and when it was updated. Always check which test it was because they're definitely not all scoring the same way.
So basically, IQ charts adjust for age - that's why you can compare a kid to an adult fairly. Each age group gets its own baseline since, obviously, a 6-year-old's brain works way differently than a 60-year-old's. When someone scores 115, they beat about 84% of people their same age, whether they're 8 or 80. It's actually pretty smart how they set it up. You can spot strengths and weak areas across any age group this way. Just make sure you're using the right age-normed chart when you're looking at results - that part matters.
So basically the IQ Standard Chart was this game-changer back in the early 1900s that gave us the whole "100 = average" thing everyone knows about. Before that, measuring intelligence was all over the place. Psychologists finally had consistent benchmarks and could rank people by percentiles, which was super helpful for schools figuring out where to place kids. Pretty controversial stuff these days though - honestly gets pretty heated in academic circles. But yeah, if you're dealing with any cognitive tests, knowing this background makes the scores way easier to understand and explain.
Yeah, there's definitely a connection between income and IQ scores. Wealthier areas usually show higher averages - we're talking like 10-15 point differences between rich and poor communities. Makes sense when you think about it. Kids from better-off families get quality schools, good nutrition, healthcare, all that stuff during those crucial early years. But here's the thing - it's not about being naturally smarter or dumber. The scores reflect opportunities more than raw ability, honestly. So whenever you're looking at IQ data, don't just take the numbers at face value. Context matters way more than people realize.
Honestly, the whole IQ thing is way overhyped. People think it measures how smart you are overall, but it's really just a snapshot of certain skills on one particular day. The scores aren't even that precise - there's like a 5-point margin of error either way. Getting 130 doesn't automatically make you Einstein, and scoring 85 doesn't mean you can't be successful at whatever you want to do. Oh, and the tests have cultural bias issues too, which is pretty messed up if you ask me. They're useful for some things I guess, but they definitely don't capture everything about how someone thinks.
Yeah, IQ tests are pretty biased tbh. Most of them reflect Western, middle-class thinking patterns since that's who usually creates them. Your language skills and cultural background totally affect how you tackle the questions. Like, some visual patterns or word problems might be foreign to you even though you're just as smart. I've seen this mess up results for people from different backgrounds - it's honestly kind of unfair. The tests assume everyone has the same cultural references, which obviously isn't true. So when you're looking at IQ scores, especially for diverse groups, take the cultural context seriously.
So basically you compare their scores to what's normal for their age group. If they're scoring way below or above that 85-115 average range, that's your red flag for who might need extra help or more challenging work. But here's the thing - don't rely on just the IQ score. I always tell teachers to look at how kids actually perform in class too, plus other tests they've taken. Sometimes a kid tests poorly but is actually brilliant in discussion, you know? Use the chart as your starting point, then dig deeper from there.
Look, IQ is great for the technical stuff - problem-solving, logic, all that. But EQ? That's where you learn to actually work with people without wanting to strangle them. Reading the room, managing your own emotions when your coworker's being impossible again. Honestly, I've seen brilliant people crash and burn because they couldn't handle basic social situations. You need both. IQ gets you in the door, but EQ keeps you there and helps you advance. If you're hiring or just trying to figure out your own development, don't just focus on test scores.
Yeah, so different countries actually mess with their IQ tests quite a bit. East Asian ones focus way more on math stuff, while European tests lean into verbal reasoning. Pretty wild how much culture affects this! Each country basically sets their average at 100 for their own population, which makes sense I guess. The tricky part is when people compare international scores - you could be looking at totally different test versions. Some countries' charts can be off by like 5-15 points from what we'd expect. Always worth checking which test they actually used before drawing any conclusions.
Dude, brain scans have totally flipped our understanding of IQ. Those fMRI things show it's not just one area lighting up - your prefrontal cortex and parietal regions are basically having a whole conversation when you problem-solve. White matter integrity matters way more than anyone thought too, which honestly makes sense. Processing speed is huge. Here's the thing though - IQ tests only capture part of what's actually happening up there. Your brain's intelligence network is this crazy dynamic system that's way more complex than any single number could ever show. Wild stuff.
So the Flynn effect is this thing where IQ scores keep going up over time. Your chart gets updated every so often to keep 100 as average - otherwise we'd all look like geniuses compared to people from the 50s lol. Someone scoring 100 today would've hit maybe 115 back then, which is kinda crazy. The chart you're using shows current standards, not old ones. Just something to remember if you're looking at test results from way back or comparing different time periods. Otherwise you'll think our grandparents were way dumber than they actually were compared to their peers.
Honestly, IQ charts are pretty sketchy when you think about it. Cultural background totally skews results - like, someone brilliant might bomb because the test doesn't match their experience. Same goes for kids from different economic situations or anyone with learning differences. The whole thing has this gross history of being used to discriminate against people too. I'd never judge someone based on just a number. Look at the whole person instead. Also worth checking if the test even makes sense for whoever took it. Don't let scores become some permanent label, you know?
Yeah, so IQ scores do match up with certain skills pretty well. Working memory has the strongest connection - like when you're doing math in your head or following complex directions. Problem-solving and pattern recognition are big ones too. But here's what's interesting - your brain doesn't work evenly across everything. Maybe you're killer at verbal stuff but spatial reasoning makes you want to cry (or the other way around). Processing speed matters a lot for your overall score. Don't just look at the total number though. Check out the subtest breakdown - that'll show you where you actually shine versus struggle.
Yeah, there's tons of stuff beyond regular IQ tests! Emotional intelligence assessments like the EQ-i 2.0 are pretty solid. Howard Gardner's multiple intelligence thing is interesting too - it looks at musical, spatial, linguistic abilities separately instead of just one score. Performance-based tests show how people actually use what they know in real situations. Culture-fair tests try to cut down on bias, which honestly makes sense. There are also practical intelligence tests focused on everyday problem-solving rather than abstract stuff. Really depends what you're trying to figure out though - different tests work better for different goals.
So IQ charts can help match people's cognitive strengths to careers that actually fit. Higher scores? Maybe push them toward analytical stuff. Average scores work great for roles focusing on creativity or people skills instead. Honestly, it's just one tool though - personality and what someone's passionate about matter way more in my opinion. I'd use it as a conversation starter to dig into their actual strengths. Then you can explore what they're genuinely excited about. It gives you a baseline for problem-solving ability, but don't make it the whole picture.
-
Graphics are very appealing to eyes.
-
Awesome presentation, really professional and easy to edit.
-
Very unique and reliable designs.