

 0 Comment
 Customer Reviews

There are times when you have to let the numbers do the talking. Numbers are a great way to present your position and vulnerability in business or any corporate surroundings. They help increase and sustain market growth.
With such knowledge and research, we at SlideTeam introduce clients and businesses with our many Slide designs, which you can use to celebrate your double-digit accomplishment in style. Our templates are designed with your ease of use in mind, empowering you to create visually stunning presentations without the need for extensive design skills. Now that significant statistics have been highlighted, you may use this template to display relevant data that doesn't require a comparison slide. Demonstrate a shift in value and more overtly identify firm victories to clarify to the audience which metrics they should focus on.
Check out some of the best designed templates on Database Report. Click here!
With various graphs and charts, including pie charts, bar charts, and dashboard summaries, you can rapidly display all the crucial data simultaneously. This presentation, which has well-defined divisions, vibrant colors, and symbols that offer the necessary explanations, conveys much information without sacrificing visual appeal. Our versatile templates cater to various data visualization needs, ensuring you can find the perfect design for your requirements.
Make your survey data reliable and accurate with the help of SlideTeam’s survey data analysis templates.
Let’s begin!
Template 1 – Number in Circles with Ticks Image
Download our comprehensive PPT Template on a picture of circles with numbers on them. This slide perfectly highlights additional phases, levels, or stages in the process while emphasizing the completion of any assignment or project. Utilize this presentation to illustrate the many phases or steps a project goes through to give a clear visual cue for each step's completion or verification. It also makes tracking progress visually easier. Using our templates, you can enhance your professional image, making a strong visual impact reflecting your success and achievements.

Template 2 – By the Numbers Notebook Image
Download this visual representation on a number notebook image emphasizing the steps or tasks. This PPT Slide helps to organize the numbers sequentially, making the flow of information easy to understand. Perfect for instructional materials where detailed instructions are required. They highlight crucial ideas or procedures in a study guide to help pupils concentrate on the most critical parts. Using numbers in circles is one practical visual approach for improving organization, prioritizing information, tracking progress, and adding visual appeal to notebooks. This approach is adaptable and works well in a variety of settings, including project management and education, by making the content more accessible to understand and more enjoyable for the reader.

Template 3 – Numbers in a Circle with a Prize Icon
Check out this PPT visual design to highlight key points, steps, milestones, etc. This template represents accomplishments or objectives; each number is encircled in a circle and frequently has an icon of a trophy or prize next to it. Use it to display the top ten performers on your team, salespeople, and many more. This will improve productivity and inspire more effort from them.

Template 4 – Bullet Arrow Four Options with Numbers
Download this appealing and attractive PPT Template on bullet arrows with four number options. This template illustrates any concept's four key points, options, or steps. You use this template to highlight any sequence or concept arranged in systemically sequential order to determine its importance.

Template 5 – By the Numbers 10 Points
Use this PPT Slide to define each point on the 10–point scale. This will help to present options for any topic or concept for better comprehension. After evaluating each item by the specified standards, assign a score between 1 and 10 to ensure consistency. This template can be used by anyone who wants to elucidate knowledge regarding a particular concept or criteria.

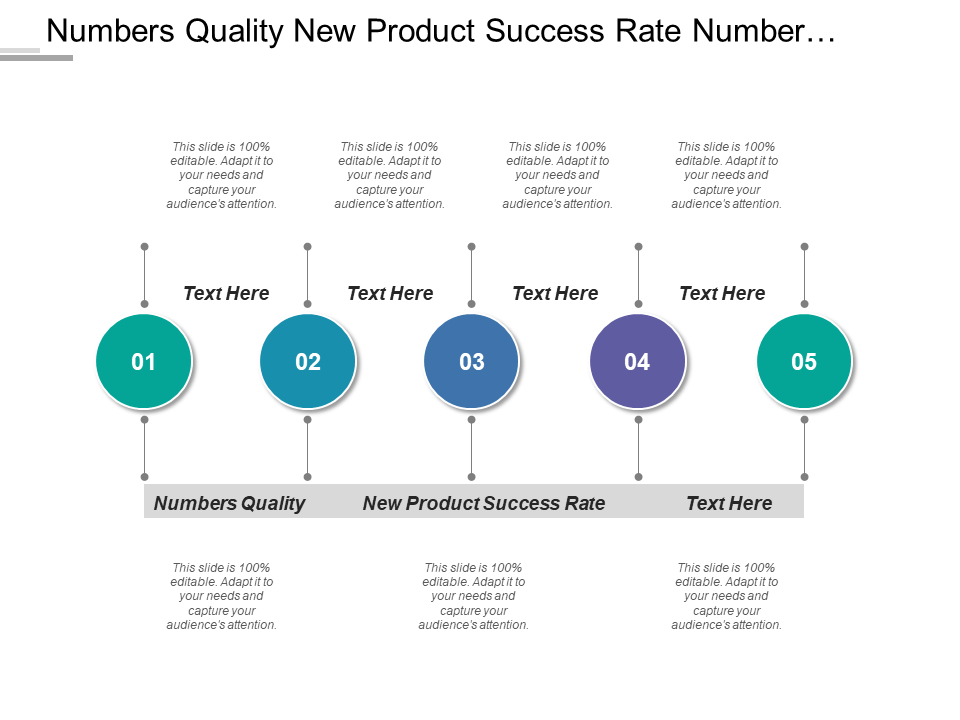
Template 6 – Numbers Quality New Product Success Rate
To evaluate and prioritize any items like numbers, quality, or new product success rate, you must download this PowerPoint Presentation. This template clearly defines each criterion and how it can be evaluated. Use the scale point from 1 – 10 to rate each item to gauge how well a good or service satisfies requirements and client expectations. These ratings show that all three criteria are critical, although quality is significantly more important than the other two. Then come the numbers and the new product success rate. Based on your priorities and situation, modify these scores.
Template 7 – 12 Circle Graphic with Numbers
This PPT is perfect for showcasing steps, processes, or critical points, It ensures your content is visually engaging and easy to follow. Customize colors, icons, and text to align with your brand or message. Enhance audience understanding and retention with this dynamic and versatile design. Download it today!

Template 8 – Numbers in a Circle with a Dollar Image
Download this 12-circle graphic template, and add a dollar image to represent financial importance. Each circle in the design represents one item with its importance score. Use this slide to show the item number, score, and description. The color and size of each circle represent the importance score, while the dollar signs identify the elements with a financial bearing. This visualization succinctly communicates the relative importance and budgetary considerations for each component.

Template 9 – Progress Bar Dashboard with Percentages and Numbers
This PPT Preset provides a clear and intuitive way to visualize the status and priority of various tasks or items. Use this dashboard with a percentage and number to rate each item based on its level of importance and convert scores into percentages.

Template 10 – Three-Level Block Numbers for Strategies of Target Marketing
Use this PowerPoint Slide to represent target marketing strategies. This slide provides a clear and structured visualization of your marketing plan to signify each level. To depict the hierarchy, use blocks arranged in three layers. Draw arrows or lines to illustrate the connections between the tiers. Each block should clearly label its corresponding strategy, technique, or action.

Conclusion
Use our well-designed and well-crafted number presentation templates to present your data clearly and consistently. These templates convey professionalism and reduce the risk of error in data presentation. Download today!
- Check out our exclusive 2 Years Comparison Template here.