

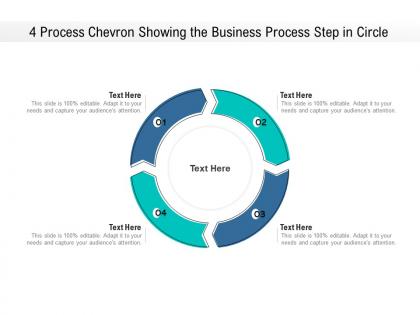
4 process chevron showing the business process step in circle




Try Before you Buy Download Free Sample Product
 Impress Your
 Audience
 100%
100% Editable
 Save Hours
 of Time


Identify acts of generosity with our 4 Process Chevron Showing The Business Process Step In Circle. Highlight excellent examples to follow.
People who downloaded this PowerPoint presentation also viewed the following :
4 process chevron showing the business process step in circle with all 2 slides:
Highlight excellent examples to follow with our 4 Process Chevron Showing The Business Process Step In Circle. Identify any acts of generosity.
FAQs for 4 process chevron showing the business process
Essential components of a business process flowchart include start/end terminals, process rectangles, decision diamonds, connectors, input/output parallelograms, and delay symbols. These elements work together by mapping workflows systematically, identifying bottlenecks clearly, and standardizing procedures across departments, with many organizations finding that well-designed flowcharts streamline operations and enhance team collaboration significantly.
Flowcharts improve communication by creating standardized visual representations that eliminate ambiguity, reduce miscommunication, and ensure everyone understands processes consistently. These visual tools streamline collaboration across departments, enable faster onboarding of new team members, and facilitate clearer discussions during meetings, with many organizations finding that flowcharts significantly reduce process-related confusion and accelerate decision-making.
Business process flowcharts use standardized symbols including ovals for start/end points, rectangles for process steps, diamonds for decision points, circles for connectors, and arrows for flow direction. These symbols streamline communication across departments by creating universal visual language, enabling teams in manufacturing, healthcare, and financial services to map workflows consistently, ultimately delivering clearer process documentation and faster operational improvements.
Flowcharts reveal inefficiencies by mapping each process step, exposing bottlenecks, redundancies, unnecessary approvals, and resource waste through visual analysis. Manufacturing companies and financial institutions use these diagrams to streamline operations, eliminate duplicate tasks, and reduce processing times, ultimately delivering cost savings and enhanced operational efficiency.
**INPUT**: What tools and software are most effective for creating business process flowcharts? **OUTPUT**: Effective business process flowchart tools include Microsoft Visio, Lucidchart, Draw.io, Miro, and SmartDraw, each offering drag-and-drop functionality, collaboration features, and industry-specific templates. These platforms streamline workflow documentation by enabling real-time collaboration, automated formatting, and seamless integration with existing business systems, with many organizations finding that cloud-based solutions deliver enhanced accessibility and faster process optimization across teams.
Flowcharts assist in onboarding by providing visual step-by-step guidance that simplifies complex processes, reduces training time, and ensures consistent knowledge transfer across departments. New employees can quickly grasp workflows in manufacturing, financial services, and healthcare operations, while trainers streamline instruction delivery, ultimately accelerating productivity and minimizing onboarding costs for organizations.
Flowcharts support business decision-making by visualizing process bottlenecks, identifying redundant steps, clarifying decision points, mapping resource allocation, and highlighting inefficiencies across workflows. Through these visual frameworks, organizations streamline operations, reduce costs, and accelerate response times, with many manufacturing and financial services companies finding that standardized process maps ultimately deliver improved operational efficiency and strategic competitive advantage.
Flowcharts integrate into project management methodologies by mapping workflow sequences, identifying critical path dependencies, and visualizing resource allocation points across project phases. Through digital project management platforms, teams streamline task coordination, enhance stakeholder communication, and accelerate decision-making processes, with many organizations finding that visual process mapping reduces project delays and improves delivery timelines.
High-level flowcharts provide strategic overviews showing major process phases and decision points, while detailed process flowcharts map specific tasks, sub-processes, roles, and system interactions within each phase. Organizations in manufacturing, healthcare, and financial services increasingly use both approaches strategically, with high-level charts enabling executive communication and detailed flowcharts streamlining operational efficiency, ultimately delivering comprehensive process visibility and enhanced workflow optimization.
Business process flowcharts should be reviewed quarterly and updated whenever significant operational changes occur, regulatory requirements shift, or performance metrics indicate inefficiencies. Many organizations find that regular reviews, combined with updates following system implementations, staff changes, or customer feedback, ensure processes remain accurate and effective, ultimately maintaining operational efficiency and competitive advantage.
Flowcharts play a critical role in compliance by documenting standardized processes, identifying control points, and ensuring regulatory adherence across organizations. They enable auditors and regulators to visualize workflows, trace decision paths, and verify that required checkpoints are consistently followed, with many financial services and healthcare institutions finding that visual process mapping significantly streamlines compliance reporting and reduces regulatory risk.
Ensuring flowchart accessibility requires using standardized symbols, clear labeling, consistent formatting, and simple language that avoids technical jargon. These design principles streamline communication by providing visual clarity, logical flow sequences, and intuitive navigation paths, with many organizations finding that well-designed flowcharts enhance cross-departmental collaboration and reduce process misunderstandings significantly.
Best practices include using simple shapes, clear labels, minimal jargon, consistent color coding, and logical left-to-right flow patterns. These approaches streamline complex processes by emphasizing decision points, eliminating technical terminology, and highlighting key stakeholder roles, with many organizations finding that visual storytelling and interactive walkthroughs ultimately enhance stakeholder understanding and buy-in.
Stakeholder feedback enhances business process flowcharts by identifying bottlenecks, redundancies, and missing steps that designers may overlook, while providing real-world insights from actual users. Through structured feedback sessions, organizations streamline workflows, improve accuracy, and ensure practical implementation, with many companies finding that incorporating frontline employee suggestions ultimately delivers more efficient processes and higher user adoption rates.
Flowcharts facilitate continuous improvement by providing visual clarity of current processes, identifying bottlenecks and inefficiencies, and enabling systematic analysis of workflow patterns. Through detailed process mapping, organizations streamline operations, reduce redundancies, and optimize resource allocation, with many manufacturing and service companies finding that visual documentation accelerates problem-solving and enhances operational efficiency.
No Reviews