


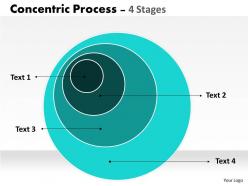
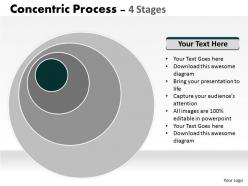
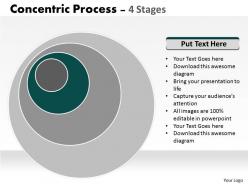
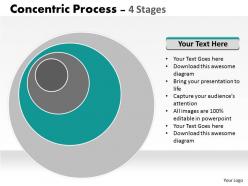
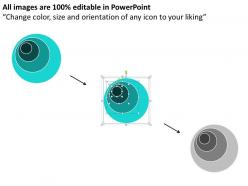
4 staged concentric circle diagram


Try Before you Buy Download Free Sample Product
 Impress Your
 Audience
Editable
of Time


Rest assured with our 4 Staged Concentric Circle Diagram. They will be by your side night and day.
People who downloaded this PowerPoint presentation also viewed the following :
4 staged concentric circle diagram with all 9 slides:
Fire away with our 4 Staged Concentric Circle Diagram as cannons. Your thoughts will definitely find their target.


FAQs for 4 staged
Concentric circles are governed by mathematical principles including constant radial distances from a shared center point, proportional relationships between circumferences and radii, and uniform angular measurements across all circles. These geometric fundamentals enable precise scaling in engineering applications, architectural designs, and data visualization models, with many technical fields finding that concentric structures deliver optimal space utilization and systematic organization.
Concentric circles in architectural design create focal points, organize spatial hierarchies, and establish radial circulation patterns from central courtyards or plazas outward. Urban planners utilize this geometric principle in city layouts, campus designs, and transportation hubs, with many finding that concentric organization enhances wayfinding, optimizes pedestrian flow, and creates harmonious spatial relationships that improve user experience.
Concentric circles appear in nature through tree rings indicating growth years, ripples spreading across water surfaces, flower petals arranged in circular patterns, and geological formations like rock layers. These natural patterns demonstrate growth cycles, energy distribution, and structural efficiency, with many scientists finding that concentric designs optimize resource allocation and provide stability in biological systems.
Concentric circles can be effectively represented through layered ring charts, target diagrams, ripple effect visualizations, nested bubble charts, and radial infographics. These presentation formats enhance data storytelling by illustrating hierarchical relationships, priority levels, and interconnected processes, with many organizations finding that concentric designs streamline complex information delivery and improve audience comprehension.
Concentric circles in data visualization serve as structural frameworks for organizing hierarchical information and multi-dimensional comparisons, particularly in nested pie charts showing category breakdowns and radar charts displaying performance metrics across multiple variables. These circular frameworks enable viewers to analyze layered datasets simultaneously, with many organizations finding that concentric visualizations enhance pattern recognition and comparative analysis, ultimately delivering clearer insights for strategic decision-making.
Concentric circles in branding create visual hierarchy, brand recognition, and symbolic depth through layered messaging, with the center representing core values and outer rings showcasing expanded services or market reach. Companies like Target, BMW, and Audi leverage this design principle to communicate brand unity, premium positioning, and comprehensive market presence, ultimately delivering memorable visual identity and enhanced customer connection.
Concentric circles create visual depth perception, enhance focus toward the center, improve spatial orientation, reduce visual chaos, and trigger calming psychological responses. These geometric patterns streamline cognitive processing by guiding attention inward, enhancing visual hierarchy in presentations and designs, with many organizations finding that concentric layouts ultimately deliver improved audience engagement and clearer information processing.
Educators can incorporate concentric circles through hands-on activities like compass drawing, ripple demonstrations, and layered geometric constructions that build spatial understanding progressively. These approaches enhance visualization skills by connecting abstract concepts to tangible experiences, with many mathematics teachers finding that students grasp radius relationships, scaling principles, and geometric patterns more effectively through interactive concentric circle exercises.
Concentric circles hold profound historical significance across cultures, representing divine unity in Buddhism's mandalas, cosmic order in Hindu yantras, spiritual protection in Celtic traditions, and celestial harmony in ancient astronomical charts. These sacred geometries continue influencing modern organizational design, branding strategies, and architectural planning, with many institutions finding that concentric structures enhance visual communication and create powerful symbolic resonance.
Concentric circles illustrate wave propagation in physics, representing how sound waves, electromagnetic radiation, and water waves expand uniformly from their source point. In acoustics, these patterns help scientists visualize sound transmission through different media, model frequency distributions, and analyze wave interference, ultimately enabling better understanding of phenomena like sonar technology, medical ultrasound applications, and architectural acoustics optimization.
**INPUT**: What methods can be used to create dynamic presentations centered around the theme of concentric circles? **OUTPUT**: Dynamic concentric circle presentations include animated layer reveals, progressive data visualization, hierarchical storytelling, interactive zoom features, and radial content mapping. These methods enhance audience engagement by building complexity gradually, organizing information from core concepts outward, and creating visual momentum, with many presenters finding that concentric designs effectively communicate strategic priorities and organizational structures.
Concentric circles establish visual hierarchy by positioning the most critical information at the center, with supporting details radiating outward in successive rings of decreasing importance. This structure streamlines complex organizational data by creating intuitive navigation paths, with many corporations using this approach for strategic planning, departmental structures, and process mapping, ultimately enhancing decision-making clarity and operational efficiency.
Concentric circles effectively represent cyclic processes through their nested, interconnected structure, symbolizing feedback loops, iterative development stages, organizational hierarchies, ecosystem relationships, and continuous improvement cycles. In business contexts, they illustrate how customer journey touchpoints, supply chain dependencies, and strategic planning phases interconnect, with each ring representing different timeframes or stakeholder levels that influence and reinforce each other systematically.
**INPUT**: What tools or software are best suited for creating visuals with concentric circles? **OUTPUT**: Professional design tools include Adobe Illustrator, Canva, PowerPoint, Google Draw, and specialized diagramming software like Lucidchart. These platforms streamline creation through built-in geometric tools, customizable templates, and layering capabilities, with many organizations finding that PowerPoint and Canva deliver accessibility alongside professional results for strategic presentations. [Word count: 50 words]
Concentric circles enhance storytelling by creating visual hierarchy, guiding viewer attention from core concepts outward, and representing layered relationships between narrative elements. These circular frameworks enable content creators, marketers, and educators to structure complex stories with clear focal points, seamless information flow, and intuitive progression, ultimately delivering more engaging and comprehensible visual narratives.
-
Qualitative and comprehensive slides.
-
Good research work and creative work done on every template.