

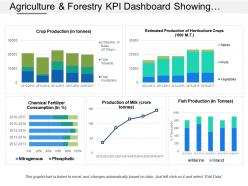
Agriculture and forestry kpi dashboard showing crop production and chemical fertilizers consumptions





Try Before you Buy Download Free Sample Product
 Impress Your
Audience
 100%
Editable
 Save Hours
of Time


Download agriculture and forestry KPI dashboard showing crop production and chemical fertilizers consumption PowerPoint design. This presentation template enables you to evaluate the performance on regular basis as you can analyze your profit and see how much profit your organization has earned in the last quarter or year. The dashboard PPT slide shows different performance related metrics such as crop production, chemical fertilizer consumption, estimated production of horticulture crops, mil production and fish production. Professionals working in the agriculture industry don't have much time to create the report on business data and then share it with corporate leaders and other associates. Our presentation graphic helps you to present any kind of information related to the industry in the most organized way. Besides this, you can also use this PowerPoint diagram to share information about other aspects of agriculture such as crop cultivation, livestock production, environment impacts, agriculture science, agrochemicals, plant breeding etc. This PPT layout is perfect for you in every way. So, download and use it for performance evaluation. Identify the cause of the jinx with our Agriculture And Forestry Kpi Dashboard Showing Crop Production And Chemical Fertilizers Consumptions. Find out how ill fortune is being created.
People who downloaded this PowerPoint presentation also viewed the following :
Agriculture and forestry kpi dashboard showing crop production and chemical fertilizers consumptions with all 6 slides:
Explode into activity with our Agriculture And Forestry Kpi Dashboard Showing Crop Production And Chemical Fertilizers Consumptions. You will feel a gush of energy.


FAQs for Agriculture and forestry kpi dashboard showing crop production and
Revenue per acre is honestly what most farmers obsess over - can't blame them. For the basics, track yield per acre and cost per unit produced first. Water and fertilizer efficiency ratios matter a lot too. Quality metrics are huge depending on your crop. Labor productivity and equipment utilization will show you where you're bleeding money operationally. Oh, and soil health scores if you care about the long-term stuff. The seasonal thing makes it weird since you're comparing last year to this year instead of monthly trends. Start simple with yield and costs, then add the other metrics once you've got those down.
Your yield per acre is basically how much money you're making from your land. Better yields = more product to sell without buying more ground, which obviously boosts profits. But here's the thing - don't just chase maximum yield because sometimes that actually costs you money. I've seen guys dump so much into inputs that their per-acre costs eat up any extra revenue. You gotta track both your yields AND what you're spending to hit them. The sweet spot isn't always maximum production. Sometimes backing off a little actually puts more cash in your pocket at the end of the season.
So soil health stuff is pretty much your farming foundation - affects yields, costs, all that. Check organic matter, pH, nutrients, compaction levels. Honestly, good soil just makes everything easier down the line. You'll catch issues before they tank your crops, dial in fertilizer amounts better, make smarter calls on rotation. The trick is pulling this data into whatever tracking system you're already using. That way you can actually see how soil improvements hit your profits over a few seasons. Makes the whole operation way more predictable.
Hey! So basically you want to track gallons used per ton harvested - that's your main number. I do mine monthly but some people go seasonal depending on what they're growing. Simple math: total irrigation ÷ crop yield. Though honestly, factoring in rainfall makes it way more accurate if you're not lazy about it lol. One thing that's actually smart is tracking revenue per gallon instead of just yield - gives you the real business picture. Start logging everything now so you'll have decent baseline data for next season. Compare against other farms in your area growing similar stuff and watch for trends over time.
Start with soil testing monthly - track organic matter, nitrogen, and pH levels. Yields per hectare are obvious but crucial for each crop. Pest and disease rates matter tons since that's honestly where rotation saves you money long-term. Also watch your input costs and profit margins by field section. Water usage changes like crazy between different rotation crops, so don't ignore that. I'd compare everything year-over-year to catch trends early - my neighbor waited too long and missed some obvious patterns. Monthly testing sounds like a lot but it's worth it.
Track stuff like acres per worker-hour or yield per labor dollar - you'll be shocked at the differences between your teams. This data shows you who's crushing it and who needs help. Plus it makes hiring decisions way easier. Should you bring on seasonal workers or just train the crew you have? The numbers tell the story. I'd start small though, maybe just 2-3 metrics so you don't go crazy with spreadsheets. You can use this to set realistic budgets and figure out who deserves a promotion. Honestly, most farms leave money on the table by not measuring this stuff properly.
Honestly, soil health should be your starting point - track organic matter percentage and erosion rates since everything builds from there. Water efficiency and reducing chemical inputs (fertilizers, pesticides) are massive wins too. Carbon footprint per unit is getting big attention lately, but fair warning - the math can be annoying as hell. I'd also look at biodiversity stuff like beneficial bug populations and how diverse your crop rotation is. Energy per acre matters too, obviously. Don't try tracking everything though. Pick maybe 3-4 that actually make sense for your operation and stick with those consistently.
Dude, you gotta check out IoT sensors - they'll track soil moisture and temp 24/7 so you're not constantly walking fields. Drones are game-changers for spotting crop issues across huge areas (and they're fun to fly, not gonna lie). All that data feeds into farm management software that automatically calculates your yield per acre and input costs. GPS equipment logs exactly where you sprayed what and when. The dashboards make tracking way easier than spreadsheets. Honestly, just start with a couple sensors in your best fields - you'll see how much better decisions get with real-time info.
Look, when you're losing 20-30% of crops between harvest and market, that's huge money bleeding out. Not just the food itself - all the transport costs, storage, labor hours just wasted. Track losses at each stage separately and you'll spot exactly where things go wrong. Storage issues? Transport problems? Processing screwups? The data shows you fast. Honestly, some supply chains are more broken than you'd think until you actually measure this stuff. But once you know where the biggest losses happen, that's where you throw your resources first. Makes the whole operation way more efficient.
Track yield per acre, cost per unit, and profit margins first - those are your bread and butter metrics. Revenue per acre matters too, especially if you're comparing different farm types. Labor efficiency is solid (output per labor hour), plus what you're spending on inputs versus total revenue. Here's the thing though - comparing farms is tricky since an Iowa corn operation looks nothing like a California vegetable setup. Different regions, different benchmarks entirely. I'd find 3-5 farms similar to yours and ask for their numbers. That's honestly your best bet for real comparison data.
Dude, KPI dashboards are game-changers for farming. Real-time data on soil moisture, crop yields, all that stuff - no more waiting around for reports. Weather patterns and equipment performance are the big ones to watch. You'll get pinged when irrigation drops or pests show up, so you can actually do something about it before it costs you. Mobile alerts are clutch since you're not always glued to a computer. Oh, and customize it for whatever you're growing - don't clutter it with irrelevant metrics. Honestly feels like cheating sometimes, having all that info at your fingertips.
So basically, your input-output ratio shows how well you're turning your costs (seeds, fertilizer, labor) into actual profit. Below 1:2? You're probably bleeding money. Above 1:4 means you're doing something right. I'd track this every quarter - sounds like a pain but it's honestly the only way to know if you're making smart choices or just staying busy. Oh, and definitely break it down by crop type. You might discover that corn's crushing it while soybeans are tanking your numbers. It's like having a reality check for your wallet.
When prices are all over the place, revenue KPIs become way more critical than your usual production numbers. You'll want to watch price per unit and profit margins like a hawk - honestly, daily instead of weekly. Yield's still good to know, but here's the thing: sometimes a smaller harvest at the right price beats a massive one sold too cheap. I'd set up margin alerts so you can pivot your selling strategy fast. Oh, and revenue per acre becomes huge during these crazy swings. Production metrics? They're nice but they won't save you if timing's off.
Honestly, this stuff gets complicated fast, but start simple. Pick one thing - like corn or your cattle operation - and track CO2 equivalent emissions per unit. So tons of CO2e per bushel or per head. Most people use carbon accounting software since there's a ton of different emission sources to calculate. Direct ones are fuel, fertilizers, livestock. Then you've got indirect from electricity and other inputs. The trick is getting a solid baseline first, then you can actually see if you're improving. Don't try measuring everything at once or you'll go crazy.
Track your cost per acre against what you used to spend on conventional methods. Organic buyers pay 20-40% more typically, which helps offset lower yields during transition. Honestly, the first couple years can be rough yield-wise but that's expected. Labor costs will jump since you're doing way more hands-on work. Certification fees are annoying but track them as percentage of revenue. Soil health stuff like organic matter percentage matters tons for long-term success. Customer retention tends to be better with organic buyers - they stick around. Just compare everything to your old numbers so you can actually see what's happening.
-
Presentation Design is very nice, good work with the content as well.
-
Visually stunning presentation, love the content.