


Dashboard For Smart Agriculture Management And Task Scheduling




Try Before you Buy Download Free Sample Product
 Impress Your
 Audience
 100%
100% Editable
 Save Hours
 of Time


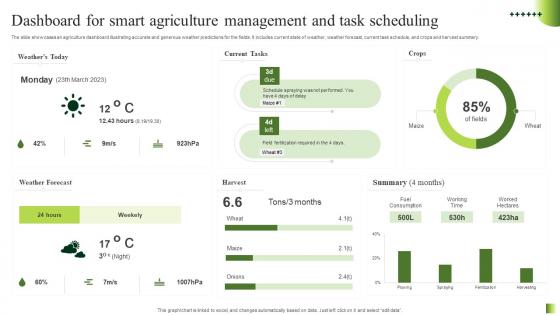
The slide showcases an agriculture dashboard illustrating accurate and generous weather predictions for the fields. It includes current state of weather, weather forecast, current task schedule, and crops and harvest summary.
People who downloaded this PowerPoint presentation also viewed the following :
Dashboard For Smart Agriculture Management And Task Scheduling with all 7 slides:
Use our Dashboard For Smart Agriculture Management And Task Scheduling to effectively help you save your valuable time. They are readymade to fit into any presentation structure.





FAQs for Dashboard For Smart Agriculture Management
Focus on the stuff that actually moves the needle - soil moisture, temp, pH levels, weather forecasts, and irrigation timing. Pest alerts are seriously a lifesaver, trust me on that one. Track your water usage and fertilizer rates too. Growth stages help you stay on top of timing. Oh, and equipment status because nothing's worse than finding out your irrigation system died three days ago. Make it visual with charts and color warnings so problems jump out at you. Start simple with maybe 5-6 metrics, then build from there once everyone's used to checking it.
Honestly, heat maps and charts are game-changers for ag dashboards. You'll spot soil moisture issues or crop problems instantly instead of drowning in spreadsheets. Color-coded alerts work great - red for drought stress, green for good conditions. Your brain picks up on those visual patterns way faster than numbers. Interactive graphs are clutch too since you can zoom into specific fields or time periods. I actually think scrolling through data tables is kind of pointless when you need quick decisions. Visual stuff just makes sense when your crops are on the line.
So basically these IoT sensors are like having eyes everywhere on your farm - they're feeding data straight to your dashboard 24/7. Soil moisture, weather stations, crop cameras, livestock stuff, all wirelessly connected. Temperature, humidity, pH levels, growth rates - you get real-time updates instead of guessing what happened yesterday. The tricky part is picking the right sensors for your specific crops and climate, then figuring out where to actually place them. Once you get it dialed in though, it's honestly pretty amazing how smooth everything runs together.
So you'd basically feed all your historical data - yields, weather, soil conditions, satellite images - into ML models to spot patterns and predict future harvests. Pull real-time info from IoT sensors and weather APIs to keep predictions fresh. Heat maps are honestly the best way to show yield probability across field zones, way easier to read than spreadsheets. Your models need to factor in rainfall, temperature, pests, soil nutrients, all that stuff. Oh and definitely set up alerts when predictions dip below your targets. That way you can tweak irrigation or fertilization before things go sideways.
Ugh, data formats are gonna be your worst nightmare - soil sensors love JSON but weather stations stick with CSV. Then there's that ancient farm equipment that can barely connect to anything modern. Update frequencies are all over the place too. Some sensors blast you with data every minute, others sync once a day if you're lucky. Rural internet is spotty at best, so plan for things going offline constantly. Oh, and dealing with different vendor APIs for authentication? Total mess. Start building solid data transformation stuff early and always have backup plans.
So basically these dashboards pull data from soil sensors scattered around your farm - pH, moisture, nitrogen, all that stuff. Way better than trudging through mud with test kits every week (been there, not fun). Color-coded maps show you problem spots instantly. Honestly the trend charts are pretty clutch for catching issues before your crops start looking sad. You'll get pinged when nutrients drop too low, plus some systems will tell you exactly what fertilizer to throw down. Just set up your monitoring zones once and peek at it weekly.
Definitely start with multi-factor authentication - your farm data's worth protecting. Encrypt everything between those IoT sensors and your dashboard, trust me on this one. Role-based access is huge so your field guys can't accidentally tweak manager-level stuff like irrigation controls. Keep those APIs locked down with proper tokens too. Security audits should be regular since you're literally controlling expensive equipment from who knows where. Actually, it's kinda wild how much farming depends on remote tech now. These basics will cover most vulnerabilities that could mess up your whole operation.
Dude, having your farm data on mobile is clutch. You can check soil moisture and weather alerts right from the field instead of running back to the office every time. The push notifications are what really sold me though - you'll know immediately if irrigation breaks or there's a pest issue. GPS lets you mark exactly where problems pop up too. I actually wish I'd started using mobile dashboards way earlier, would've saved me so many headaches. Most platforms have apps now, but even their mobile sites work pretty well if you bookmark them.
So basically these smart ag dashboards show you real-time stuff like soil moisture and nutrient levels across your whole farm. Instead of just spraying water and fertilizer everywhere, you can see exactly which fields actually need it. Honestly, the waste reduction is crazy once you get the actual data - some areas you think are dry are totally fine. Weather patterns help it predict optimal timing too, which is neat. I'd start with whatever areas you're wasting the most resources on first. Then just follow the zone recommendations it gives you.
So these ag dashboards are actually pretty cool for dealing with crazy weather. They'll predict what's coming and monitor your soil moisture, plus send alerts when crops are stressed. Historical data is wild too - you can literally see how temperatures have shifted over decades. The pest tracking feature uses weather patterns to show where bugs might move next, which is super helpful. Oh, and they recommend climate-tough crop varieties. Satellite images combined with field sensors give you heads up on extreme weather. I'd start with weather prediction and soil monitoring - those two features alone are game changers.
ML basically turns your dashboard into something that actually predicts stuff instead of just showing numbers. Start with yield prediction - that's where you'll see money back fastest. The algorithms dig into your sensor data, weather, past seasons and catch patterns you'd miss completely. Pretty crazy how spot-on they get after running for a while. So instead of "temp is 75°F" you get actionable stuff like "cut watering 20% this week based on what's coming weather-wise." You can do pest detection, irrigation timing, soil analysis - the whole deal. Honestly beats staring at basic charts all day.
Yeah, tons of companies are crushing it with these dashboards. John Deere's got this Operations Center thing that tracks equipment and field conditions - pretty solid stuff. Cargill uses theirs for crop monitoring and irrigation timing. Climate Corporation's platform is actually really nice (their UI doesn't suck like most farm tech) and farmers are seeing 10-15% yield bumps from their weather data and predictions. Even smaller operations are winning with this. California vineyards use systems that track soil moisture and nail harvest timing. My advice? Don't go crazy trying to dashboard everything right away. Pick your most critical data points first and build from there.
Dude, your dashboard UI is make-or-break for farmers who need info fast. Keep it dead simple - they're literally standing in muddy fields checking soil alerts on their phones. Most critical stuff goes right up top, use obvious color coding (red = bad, green = good), and don't make it look like mission control at NASA lol. Fast loading times are huge. Navigation should feel natural, like checking weather. I'd honestly just follow some farmers around first to see what data they actually need when they're stressed about their crops. The fancy visualizations mean nothing if they can't find the basics quickly.
Honestly, go with satellites plus IoT sensors to start. Satellites show you the whole picture - crop health, weather, all that field-level stuff across huge areas. IoT sensors give you the nitty-gritty real-time data (soil moisture, temp, pH levels). Drones are awesome for checking problem spots quickly, but they're kind of expensive upfront. RFID's more for livestock anyway. I'd skip the fancy stuff initially - satellite imagery combined with basic sensors gets you like 80% there without destroying your budget. You can always add drones later once you're making money from the data.
Start with figuring out who actually needs to see what - farmers don't want investor reports cluttering their view. Real-time messaging works great, plus you can add comment threads on specific metrics when something looks off. Role-based access is huge here - agronomists get crop data, suppliers see inventory stuff, that kind of thing. @mentions help when you need someone's attention fast. Honestly, shared workspaces are where the magic happens though. Teams can dig into crop performance issues together without getting buried in random data they don't care about. Build those permission layers first or you'll be fixing headaches later.
-
This visual representation is stunning and easy to understand. I like how organized it is and informative it is.
-
Best Representation of topics, really appreciable.