


Dashboard For Digital Agriculture Business Management





Try Before you Buy Download Free Sample Product
 Impress Your
Audience
 100%
Editable
 Save Hours
of Time


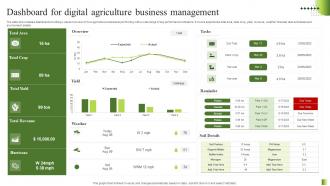
The slide showcases a dashboard providing a visual overview of how agriculture business is performing with a wide range of key performance indicators. It covers aspects like total area, total crop, yield, revenue, weather forecast, task schedules and environment details.
People who downloaded this PowerPoint presentation also viewed the following :
Dashboard For Digital Agriculture Business Management with all 7 slides:
Use our Dashboard For Digital Agriculture Business Management to effectively help you save your valuable time. They are readymade to fit into any presentation structure.






FAQs for Dashboard For Digital
Honestly, start with whatever's driving you crazy right now - your three biggest headaches. You'll want real-time stuff like soil moisture, weather data, crop health monitoring. IoT sensors are clutch for this. Mobile access is non-negotiable since you're never actually at a desk. Financial tracking hits different when you can see input costs and ROI in real time - that part's huge. Equipment monitoring dashboards help too. Make sure it plays nice with whatever farm software you're already using instead of creating yet another thing to check. Oh, and the interface better not look like it was designed in 2003.
Honestly, data viz is a game changer for farming - way better than drowning in spreadsheets. You'll actually see patterns in your soil moisture, crop health, weather stuff instead of just staring at endless numbers. Think of it like... I dunno, getting GPS instead of using those old paper maps? Spot issues way faster, compare your fields without squinting at data tables. Weather impacts and yield predictions become obvious. Just start simple though - pick your most important metrics and chart those first. Build up from there once you get the hang of it.
Dude, real-time data is what separates the pros from everyone else. Monitor soil moisture, weather, crop health - all as it's happening. Way better than finding out about problems after you've already lost money, right? You can actually catch issues early and fix irrigation or treatments on the spot. Honestly, the tech these days is pretty wild. Instead of reacting to last week's disasters, you're staying ahead of tomorrow's. My advice? Pick your worst headache first - maybe it's irrigation timing or pest issues - and start monitoring that in real-time.
So first figure out what you actually want to monitor - soil moisture, temp, whatever matters for your crops. Then grab sensors that work with MQTT, LoRaWAN, or just regular cellular. The whole API integration thing sounds scary but it's honestly pretty straightforward now. Most dashboards can handle the common protocols without much fuss. Oh, and definitely start with like 2-3 sensors max to test everything before you go crazy buying a ton of equipment. I learned that one the hard way with a different project. Just make sure your sensors can talk to whatever dashboard platform you pick.
Honestly, I'd focus on soil moisture first - that's your bread and butter. Weather data comes next, both current and what's coming. Can't stress enough how much I'm glued to weather apps during growing season, probably borderline obsessive lol. Crop growth stages round out your big three for daily calls. Temperature and precipitation trends are obvious must-haves too. After that, I'd add pest alerts, irrigation timing, and yield forecasts as your second tier. Just don't bury the urgent stuff - when weather shifts fast, you need that info right there, not three clicks deep.
So basically these algorithms will clean up all your messy sensor data and auto-fill the gaps. Pretty cool how they learn from your old farm records to predict crop yields and soil stuff more accurately over time. You'll get way fewer bogus alerts too. They're surprisingly good at catching patterns you'd never spot manually - honestly saves me tons of time. I'd start with anomaly detection first, that's the easiest win. Then add the predictive models once your data quality improves a bit.
Honestly, the upfront costs can be brutal - some systems are crazy expensive. Plus if you're not super techy, the complexity will make your head spin. Different equipment brands rarely work together smoothly, which creates this whole data integration nightmare. Rural internet is still pretty terrible in a lot of places too, so good luck with that. Training your team takes forever and you won't see returns right away. Oh, and don't try to do everything at once - I've seen people crash and burn that way. Pick one thing, get it working, then expand from there.
Honestly, these dashboards are game-changers for tracking stuff like water use and fertilizer in real-time. You'll catch waste before it hits your wallet hard. The visual data thing is clutch - patterns jump out that you'd never notice just walking around. I'd start small though, maybe pick one or two metrics instead of going crazy with everything at once. Soil health, crop schedules, even biodiversity stuff all lives in one spot. Oh, and the predictive features help you plan ahead for next season's sustainability goals. Way better than spreadsheets, trust me.
Dude, you can literally check everything from your phone while you're out in the field. Soil moisture, weather alerts, equipment stuff - no more dragging your laptop around everywhere. I was skeptical at first, but being able to adjust irrigation or catch problems right when they happen? Total game changer. Your team can stay in the loop without you running back to the office constantly. Just pull it up during your next field walk and see how it feels. Once you get used to having all that data in your pocket, you'll wonder how you managed before.
So basically you get this overhead view of all your crops through satellite feeds that show up right on your dashboard. NDVI data tells you which plants are thriving vs struggling, plus you can catch irrigation problems early. Disease outbreaks? You'll spot them before they take over entire sections. The coolest part is how it automatically flags trouble areas and updates your field maps without you doing anything. Honestly feels like cheating sometimes - in a good way. I'd start with setting up monitoring zones on your most valuable fields first, then expand from there once you get the hang of it.
Dude, farmer feedback is a game changer. They'll show you what actually matters in their day-to-day work vs. what you assumed they needed. Most developers (myself included sometimes) overcomplicate things - farmers just want quick access to the important stuff. You'll figure out which metrics they actually use and spot confusing parts of your interface. Plus they'll tell you if your data visualizations make any sense or if you're being too clever. I'd start with quick user interviews or just record them using your current dashboard. Super eye-opening to watch someone navigate your design for real.
So predictive analytics can forecast your crop yields and spot pest outbreaks before they hit. Pretty cool stuff. Historical farm data gets combined with weather patterns and soil info to predict what's coming weeks ahead. Your dashboard shows yield projections, risk alerts, and when to time interventions perfectly. I've seen some farmers completely avoid disasters just from acting on these early warnings. The trick is setting up automated alerts - otherwise you'll miss those narrow windows for irrigation or pest control. My neighbor swears by it, says it's like having a crystal ball for farming.
Honestly, you're looking at some real risks here. Data breaches are huge - all that farm data, GPS info, financial records becomes a goldmine for hackers. Your dashboard's connected to IoT sensors and equipment controls, which means tons of entry points. Most ag-tech wasn't designed with security in mind either (because of course it wasn't). Attackers could mess with your control systems or disrupt critical processes. Use strong passwords, keep everything updated, and don't work with vendors who treat security like an afterthought. This isn't just another app on your phone.
So these ag dashboards basically give you a bird's eye view of everything - crop yields, harvest timing, supply predictions. Weather data gets pulled in too, which is honestly pretty clutch for spotting problems early. Instead of scrambling when you're short on product, you'll actually see it coming weeks ahead. Your suppliers and buyers can all access the same info, so no more playing telephone with inventory numbers. Oh, and logistics tracking helps catch bottlenecks before they screw you over. I'd say start with your biggest suppliers first - that's where you'll feel the difference most.
Yeah there's actually a bunch of stuff out there for smallholder farmers. FAO and CGIAR run pilot programs in places like Kenya and India - they give out subsidized tablets with training. Rwanda has this digital extension thing that's working surprisingly well. Companies like Bayer and John Deere are teaming up with NGOs too, making simplified versions that don't cost a fortune. Honestly though? Start with your local ag extension office first. They'll know what's actually happening in your area and can help you apply for whatever's available. Way easier than trying to figure it out online.
-
SlideTeam is the way to go when you are in a time crunch. Their templates have saved me many times in the past three months.
-
The templates are easy to get, and the chat customer support is excellent.