


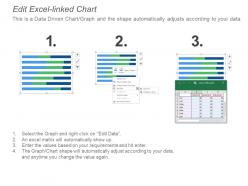
Agriculture and forestry kpi dashboard showing planting progress and seeds planted




Try Before you Buy Download Free Sample Product
 Impress Your
 Audience
 100%
100% Editable
 Save Hours
 of Time


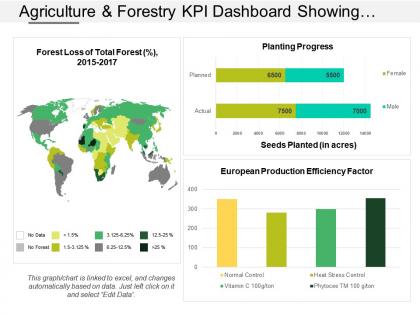
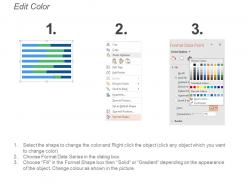
Thinking to create an innovative PowerPoint presentation design for your next business presentation. If yes, then check our agriculture and forestry KPI dashboard showing planting progress and seeds planted PPT template. This wonderful PowerPoint slideshow comes with editable bar charts and a map which reflects the efficiency of your production and the profit or loss incurred in plantation. To show the business data, you need to ensure that you are showing it in the best possible way. Giving importance to every number which you show in the slide is crucial as your team needs to understand the significance of numbers. This agriculture and forestry KPI dashboard Presentation visual is designed by keeping in mind the need for every organization. Moreover, this dashboard PPT slide has time-saving capabilities and is extremely spacious to include vast content under single screen view. Just download the presentation graphic and share it. Encourage handshakes with our Agriculture And Forestry Kpi Dashboard Showing Planting Progress And Seeds Planted. Give a boost to feelings of friendship.
People who downloaded this PowerPoint presentation also viewed the following :
Agriculture and forestry kpi dashboard showing planting progress and seeds planted with all 6 slides:
Enhance their grasp of your great ideas. Our Agriculture And Forestry Kpi Dashboard Showing Planting Progress And Seeds Planted facilitate explanations.
FAQs for Agriculture and forestry kpi dashboard showing planting progress
Start with the basics - crop yield per acre, harvest timing, and quality grades. Those matter most. Track your financials too: cost per unit, revenue per crop, profit margins. Equipment downtime kills you, so monitor that along with labor efficiency and input costs (seeds, fertilizer, the usual suspects). Weather data is massively underrated - most farmers I know barely track it properly. Don't overlook water usage and energy costs either. Inventory levels and waste percentages round it out. Pick maybe 6-8 metrics that actually apply to your setup first, then add more later.
Dude, real-time data is seriously worth it. You'll catch issues right as they happen instead of finding out days later when it's too late to fix anything. Like if your soil moisture drops or weather gets weird, you can adjust irrigation immediately rather than just crossing your fingers. Same with spotting pest problems early - way easier to deal with before they spread everywhere. The coolest part? You can time everything perfectly - fertilizing, harvesting, whatever - based on actual current conditions instead of guessing. Oh and definitely set up alerts for the important stuff so you don't have to stare at screens all day.
Track your yield per acre first - that's your bread and butter. Quality grades matter too, plus how far off you were from what you expected. I always look at crop loss percentage and revenue per acre since those numbers don't lie. Input efficiency is huge - basically how much fertilizer and water you're burning through per unit. Honestly, water costs have gotten crazy lately. Set up dashboard alerts when you're 15% off your projections either way. Those five metrics will show you what's actually happening out there.
Weather basically runs your whole dashboard because crops are just... well, they're at nature's mercy. Your yield forecasts change with every temp swing and rainfall pattern. Soil moisture? That's what decides your irrigation schedule. Then you've got humidity and heat messing with pest predictions, plus growing degree days telling you when stuff will actually be ready. Oh, and don't get me started on surprise frosts - they'll wreck your entire season in one night. Set up weather alerts so you can catch problems early. Trust me, it's way cheaper than playing catch-up later.
Dude, just automate that stuff. Your farm management software, sensors, weather stations - they can all feed data straight into your dashboard without you touching anything. Honestly saves me like 3 hours a week that I used to waste on spreadsheets. Set it to update however often you want, real-time or daily, whatever. The cool part is spotting weird patterns way faster than you ever could manually. My buddy still does everything by hand and I'm like... why torture yourself? Get those automated feeds running first - seriously wish I'd done it sooner.
So basically, a KPI dashboard shows you in real-time how you're burning through resources - water, fertilizer, labor, all that stuff. You can catch inefficiencies before they tank your profits. Like, you'll notice one field is guzzling way more water than it should, or you're throwing money at inputs that aren't paying off. Honestly beats just winging it based on gut feeling. Track things like cost per acre and ROI on different inputs. My advice? Start with your biggest resource drains first - that's where you'll see results fast. Way better than trying to fix everything at once.
Dude, putting your farm data on a visual dashboard is a game changer. Raw spreadsheets are brutal to look through - I mean, who has time for that? Charts and graphs make everything pop out instantly. Crop yield trends, resource usage, problem spots... it all becomes obvious. Your team can make quick calls on irrigation and fertilizer timing instead of drowning in numbers. Honestly, it's like night and day compared to endless Excel rows. Stakeholders love it too since they don't have to decode technical stuff. Just start with your biggest pain points first.
Track your pH, organic matter, and NPK levels first - those hit yield the hardest. Soil compaction and water retention matter too, but honestly pH is where I'd start since it affects everything else. IoT sensors make this way easier now than the old days of sending samples to labs and waiting forever. Set up alerts when pH drops or organic matter gets low. Each field needs its own baseline measurements, then you can spot the bad trends before they tank your harvest. Oh and those real-time sensors? Game changer for catching problems early.
Start with gross margin per acre - just revenue minus your direct costs like seeds and fertilizer. Operating expense ratio matters too (total expenses divided by revenue). Cash flow timing will make or break you since farm income is so seasonal. I always think monthly reviews beat waiting until year-end when you can't change anything. Cost per unit shows where you're wasting money. Oh, and don't forget return on assets and debt-to-equity - those tell you if you're actually building wealth or just staying busy.
Honestly, KPI dashboards are game-changers for sustainable farming. You can track water usage per crop yield, soil health, energy consumption - stuff that actually moves the needle. Instead of getting smacked with massive fertilizer bills months later, you'll catch overuse right away. The trend analysis is where it gets interesting though - patterns emerge that help you optimize resources without tanking productivity. My neighbor started with just water and soil metrics and saved like 20% on inputs the first year. Pick 3-4 sustainability metrics you really want to nail and build around those first. Don't overcomplicate it initially.
Pull your IoT sensors, GPS stuff, and variable rate tools straight into dashboard widgets - soil moisture, yield maps, fertilizer rates by zone. That granular data is what actually makes precision ag worth it. Automated pipelines are clutch here because manually importing CSVs every week will drive you nuts (trust me). Heat maps and zone visualizations work best since that's where you'll see the real patterns. I'd start with maybe 3-4 key metrics like soil variability and input efficiency. You can always add more later once you've got the basics dialed in.
Oh man, the data silo thing is brutal - soil sensors, tractors, weather stations all doing their own thing with zero compatibility. Half your crew's still writing stuff down by hand (which honestly drives me crazy), and everyone records differently so your data's all over the place. Remote fields have garbage connectivity too, so forget real-time anything. I'd just pick one or two things you can actually track consistently first. Maybe yield data or fuel usage? Then expand once you've got that dialed in. Don't try to digitize everything at once or you'll lose your mind.
Look, if your dashboard is confusing, people just won't use it - period. You want farmers checking soil moisture from their phones while they're actually walking the fields, right? Put the most critical stuff upfront and make navigation dead simple. Nobody has time to dig through messy screens when there's real work happening. Clean layouts save everyone from those painful training sessions too. Honestly, I've seen too many fancy dashboards that look great in presentations but are useless day-to-day. Mobile-friendly is non-negotiable since half the time you'll be checking yields from a tractor cab anyway.
Dude, you absolutely need those benchmarks or you're just guessing at everything. Like yeah, 150 bushels per acre sounds decent, but is it? Turns out that's actually 20% higher than what most folks around here are getting. Industry standards show you where you're crushing it and where you're... well, not. Your state extension office usually has solid baseline data, and commodity groups put out reports too. Trust me, lenders and buyers want to see how you compare to everyone else anyway. Without that context, your "good" numbers might actually be pretty average for your area.
Honestly, just pick KPIs that make sense for what you're actually growing. Corn and soybeans? Track plant population and nitrogen efficiency. Got an orchard? Focus on tree health and fruit grades instead. Organic vs conventional is totally different too - you're not worried about the same pesticide stuff. If you're doing precision ag with all the fancy tech, soil variability maps are clutch. But running a small veggie operation? Simple yield per bed works fine. I'd just make a list of what "winning" looks like for each crop first, then build your metrics around that.
-
Topic best represented with attractive design.
-
Innovative and Colorful designs.