Globally, 70% of website visits in 2020 were from mobiles. This tiny device of colors, sizes, and shapes has boosted the degree of accessibility and computing, becoming a global rage.
Mobile phones have joined the expanding galaxy of connected screens and devices used to gain instant access to the world's information. Their market ‘capture’ has significantly altered how people plan and work. Businesses have also realized that mobile devices in general, as opposed to desktops, are being used for real-time reporting and immediate access to accurate, up-to-date information. This has opened the door for developers and IT experts to tailor most apps and dashboards for mobile use, technically called the ‘mobile-first’ policy.
Check out our blog on Insight Dashboards for more information on how to define strategies and drive actions to boost business through data.
Mobile dashboards offer a degree of accessibility that is difficult to match. These provide a more effective and productive visual depiction of data that quantifies a company’s performance against its goals. Top-notch user interfaces (UI) and intuitive features in mobile dashboards assist professionals/developers in keeping stakeholders informed of job progress and delivering creative digital solutions to clients across industries.
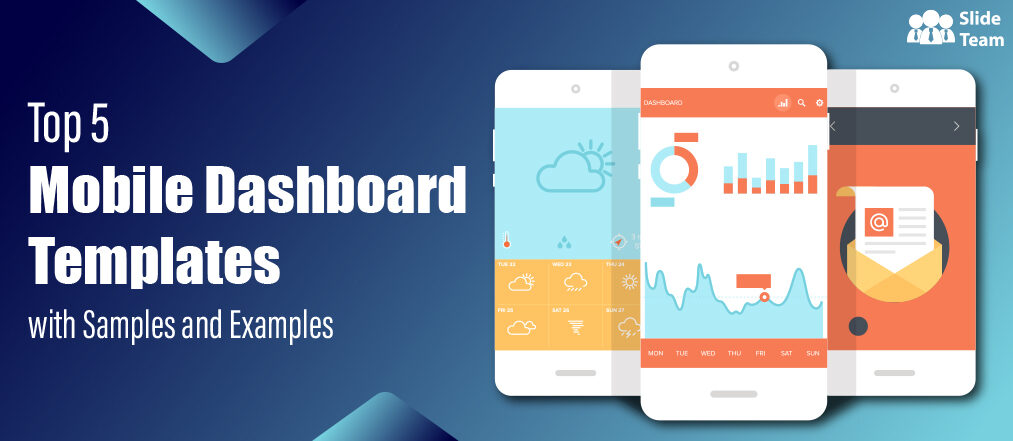
This blog will help you to pin all key components of your business strategy and KPIs on, and for, your mobile device. Use this list of the Top 5 Mobile Dashboard Templates from SlideTeam to construct data visualization applications for small, mobile devices on usage, adoption and changing trends in business. These PPT Templates will help professionals depict necessary information for each client/department, making them clear and concise to read.
Discover a few tips and tricks to help you present your data beautifully and with the much-needed WOW factor! To learn more, Click here .
Use these templates for quick access to crucial information and to monitor your progress toward goals on the move.
Identify trends and turning points with SlideTeam’s best-in-class PowerPoint Templates!
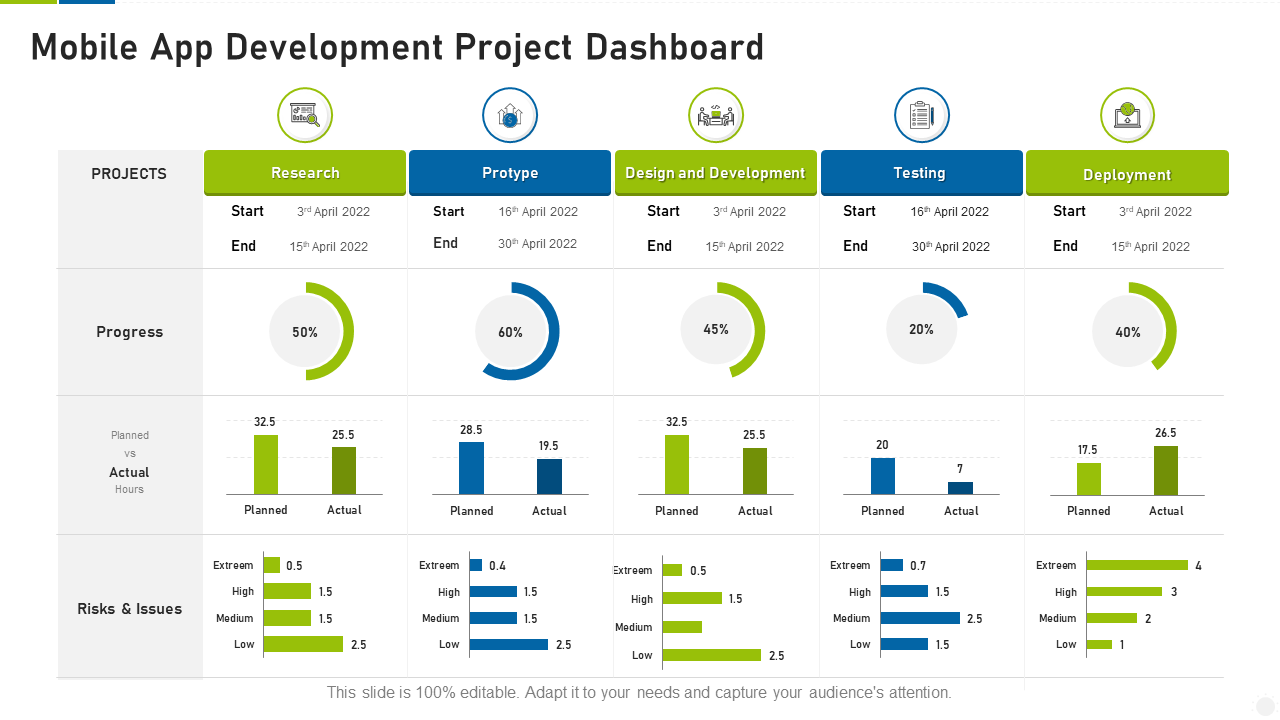
Template 1: Mobile App Development Project Dashboard PPT
Do you want your mobile apps to be a success? Use this PPT Template to create a well-structured dashboard for mobile app development. This will allow you to create wireframes and prototypes to assist the project development team in identifying risks and issues while visualizing the app to ensure that everything is planned. The slide contains these key elements: Design and development, deployment, and research to facilitate businesses in identifying any glitches or problems with the app.
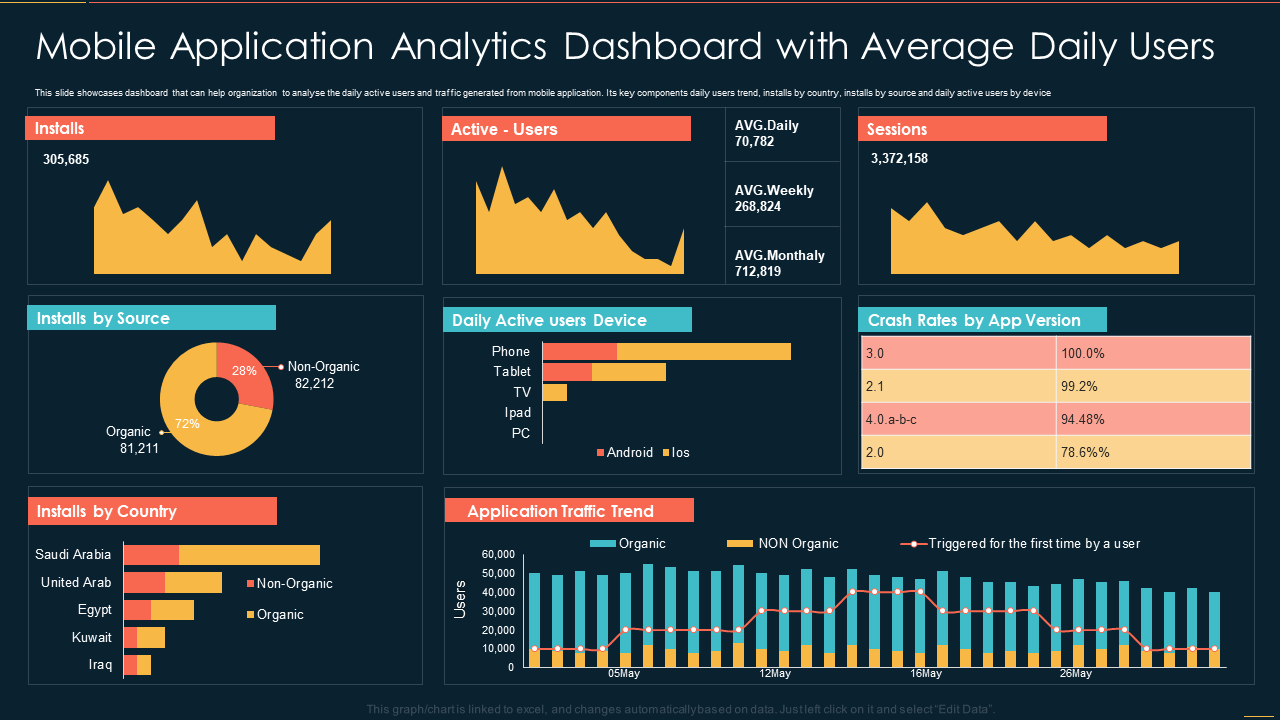
Template 2: Mobile Application Analytics Dashboard with Average Daily Users Template
Discover installs, crashes, UI freezes, and hidden UX issues for continuous progress. Use this PowerPoint Template to demonstrate analytical metrics ranging from how users discovered the app to what drives engagement, shares, and churn. This dashboard template will allow you to assess the performance of your application, its features, user behavior, and more. This slide illustrates these KPIs: Daily user trend, installs by country, installs by source, and daily active users by a device to analyze daily active users and traffic that mobile applications generate. Use this download to improve your app's user focus.
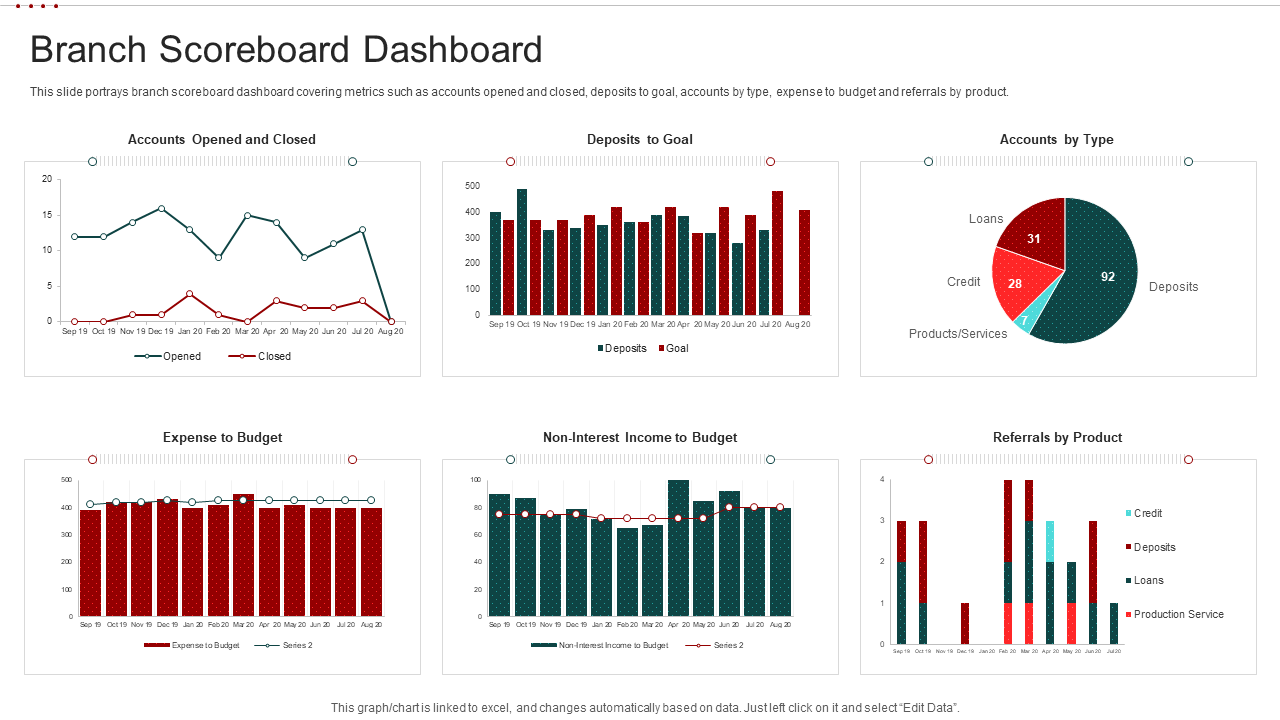
Template 3: Mobile Banking Solution for Branch Dashboard PPT
Mobile banking solutions offer insights into resource optimization and service efficiency. Use this PPT Template to assess a financial institution's efforts to improve the banking experience of the customer. This scoreboard dashboard includes metrics such as accounts opened and closed, deposits against the goal for the period, accounts by type, the expense to budget, and product referrals to help the bank increase sales. Use the PowerPoint Slide to obtain real-time reports for improving the branch operating model, such as personalized, data-driven sales and performance management.
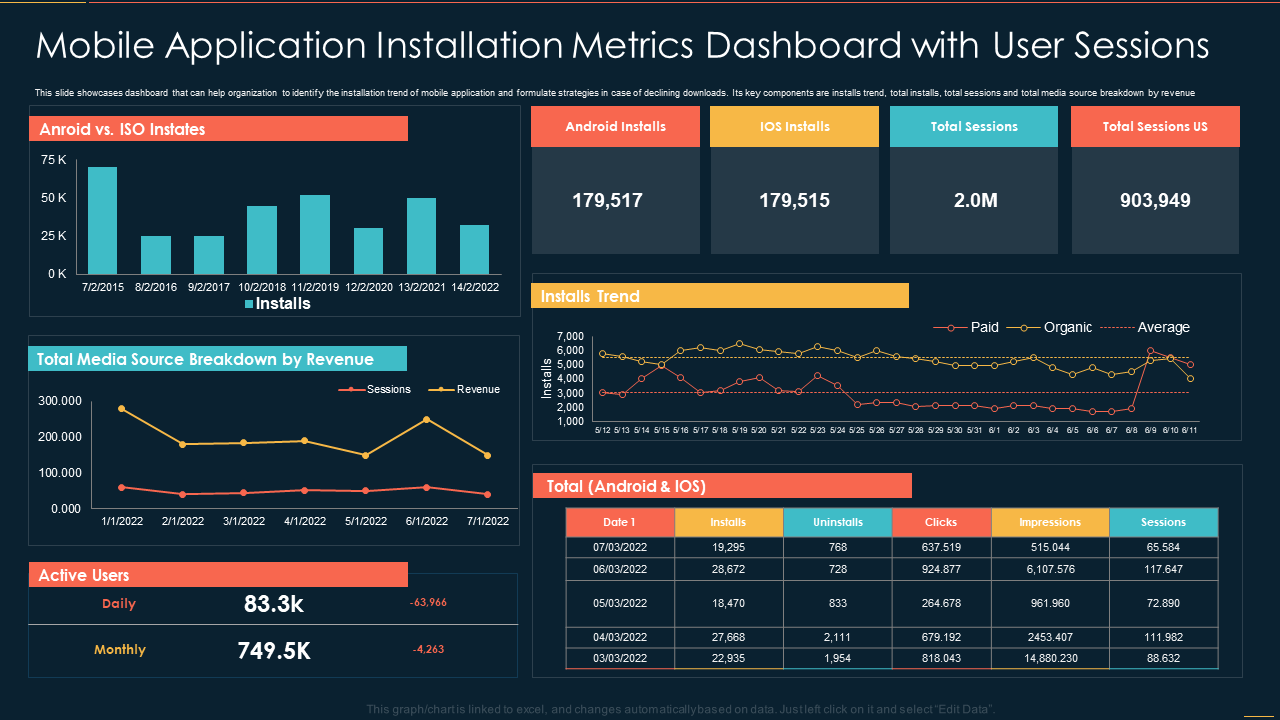
Template 4: Mobile Application Installation Metrics Dashboard with User Sessions PPT
Use this PowerPoint Template to examine mobile app installation trends in your company. This dashboard tracks the progress of an app project in terms of user engagement. The installation trend in mobile field service will assist your company in developing tactics to reduce churn rates. Its key components are trend in installations, total installs, total sessions, and total media source breakdown by revenue to understand the effectiveness of your engagement campaigns — and, more importantly, the quality of your user experience. Help stakeholders track sales, typical check size, customer acquisition costs, retention rate, downloads, and user satisfaction with this presentation template.
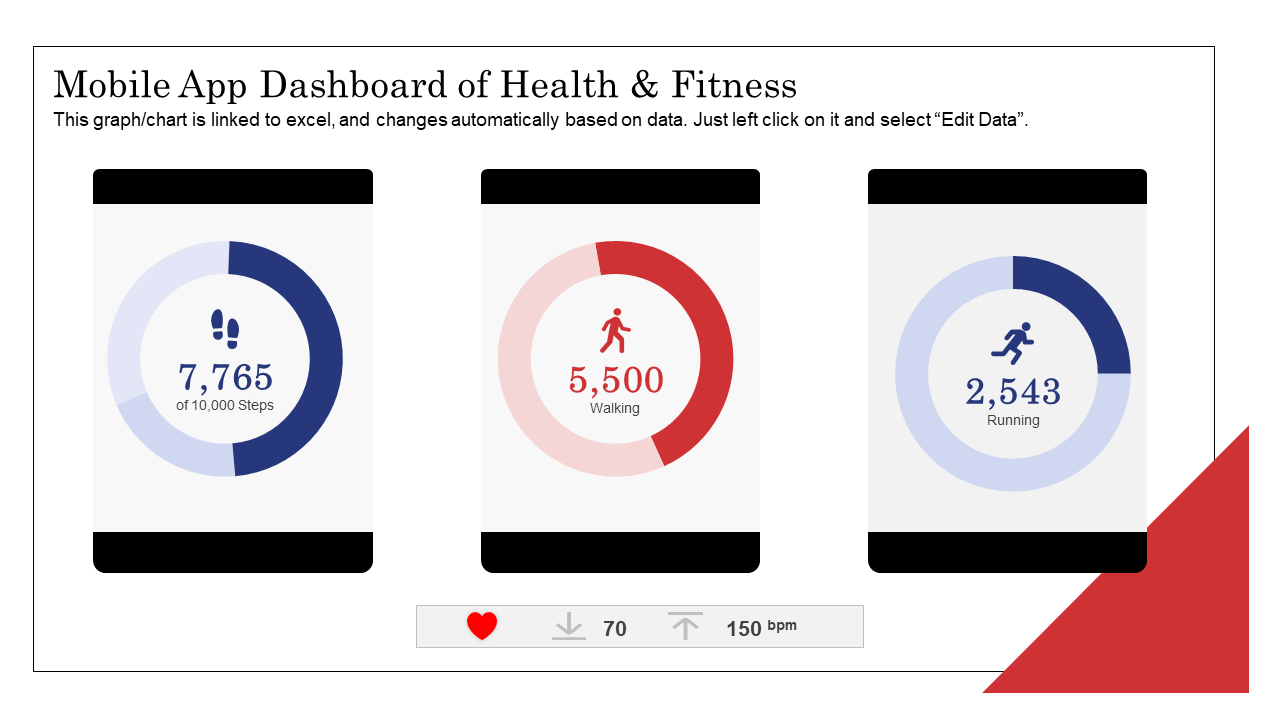
Template 5: Mobile App Dashboard on Health and Fitness
Assess your health stats in greater depth. Use this PPT Template to see a summary of all workouts by date or by type. With smart icons and intelligent use, this pre-designed dashboard will help you keep track of your workout data. Use this PowerPoint Slide to set your pedometer data or any goal/metric to your liking and track your health stats on the go.
Data sources at your fingertips
Create, save, and open performance dashboards on your mobile screens to assess the growth of your business. A well-designed mobile dashboard will provide the information needed to determine the status of each KPI in relation to the business objectives. This will help businesses with goals and insights to help these grow. Use SlideTeam’s PowerPoint Templates to examine correlations between metrics, examine historical data, and monitor the health of your business.
PS: Explore our guide on User Dashboard to better understand user behavior patterns and increase retention rates.
FAQs ON MOBILE DASHBOARD
What is a mobile dashboard?
A mobile dashboard is a visual depiction of KPIs and information pertaining to divisions of a company or organization. It offers an instant snapshot of parameters via mobile devices while on the go. Businesses analyze this data, spot trends, and show essential metrics and user-relevant data on an intelligent and engaging platform. The capacity to track corporate performance and operations in real-time, whenever and wherever, is helpful in today's competitive business market in the following ways:
- Provide better real-time data access than a conventional system.
- Ensures faster decision-making.
- It helps establish new or improved business models strengthen strategic planning and raise the possibility of standing out from competitors.
- These dashboards increase businesses' capacity to communicate information and keep everyone informed.
What is the one major use for mobile dashboards?
Businesses can use mobile dashboards to track user engagement, create systems to redesign UI or UX elements, gain insights to increase ROI, and make well-informed decisions. The greater accessibility has elevated these dashboards to the top of the list of business operations.
For example, real-time and quick access to patient's health information, reports, and other statistics has enabled healthcare workers to better serve patients. With the mobile dashboard, healthcare staff can assist patients by displaying personalized KPIs in real-time and providing appropriate prescriptive recommendations based on the patient's medical history.
What are the best practices for a mobile dashboard design?
- Responsive design that adapts to all screens or devices, including watches, TV screens, tablets, and smartphones.
- A mobile dashboard should have trend KPIs, critical details, and concise statistics on the landing page. This makes it easier to read a lot of charts and numbers.
- To maintain uniformity, the user interface (UI) styles and layout of your mobile dashboards should be the same as those of your real-time business dashboard.
- The use of filters facilitates quick access to data perspectives and enhances customer satisfaction.
- Make sure the dashboard is tested on a range of devices to evaluate the working of layouts and graphics.




 Customer Reviews

