

Ansoff 4 box grid illustrating growth strategy




Try Before you Buy Download Free Sample Product
 Impress Your
Audience
 100%
Editable
 Save Hours
of Time


Our Ansoff 4 Box Grid Illustrating Growth Strategy are topically designed to provide an attractive backdrop to any subject. Use them to look like a presentation pro.
People who downloaded this PowerPoint presentation also viewed the following :
Ansoff 4 box grid illustrating growth strategy with all 2 slides:
Use our Ansoff 4 Box Grid Illustrating Growth Strategy to effectively help you save your valuable time. They are readymade to fit into any presentation structure.


FAQs for Ansoff 4 box grid
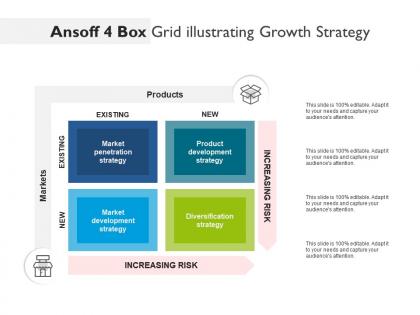
The four growth strategies in the Ansoff Matrix include market penetration, market development, product development, and diversification. These strategies enable organizations to systematically evaluate expansion opportunities by analyzing existing versus new products and markets, with many companies finding that this framework streamlines strategic planning, enhances resource allocation, and ultimately delivers competitive advantage in increasingly complex business environments.
The Ansoff Matrix helps businesses evaluate product-market strategies by categorizing growth opportunities into four quadrants: market penetration, market development, product development, and diversification. This framework enables companies to assess risk levels systematically, allocate resources strategically, and identify expansion paths, with many organizations finding that structured evaluation leads to more informed strategic decisions and sustainable competitive advantage.
Market penetration focuses on increasing sales of existing products to current customers through competitive pricing, enhanced marketing, or improved distribution, while market development involves selling existing products to new customer segments or geographic markets. These strategies help organizations maximize current offerings, with market penetration strengthening customer loyalty and market share, while market development expands reach and reduces dependency on single markets, ultimately delivering sustainable growth and competitive advantage.
Businesses should consider market knowledge, resource availability, risk tolerance, competitive landscape, and financial capacity when selecting Ansoff Matrix strategies. Companies with strong market research capabilities might pursue market development, while those with robust R&D departments could focus on product development, ultimately delivering sustainable growth and competitive advantage in an increasingly dynamic business environment.
Diversification in the Ansoff Matrix presents both related and unrelated pathways, with related diversification leveraging existing capabilities, technologies, or customer knowledge, while unrelated diversification enters completely different markets with new products. Related approaches, like banks expanding into insurance services, typically reduce risk and enable operational synergies, whereas unrelated strategies offer greater growth potential but require substantial resource investment and market learning.
Companies like Apple exemplify effective Ansoff Matrix application through market penetration with iPhone upgrades, product development via Apple Watch launches, market development by expanding into emerging economies, and diversification into services like Apple Pay. Amazon similarly demonstrates this strategic framework by penetrating existing markets through Prime enhancements, developing new products like Alexa, entering new geographical markets, and diversifying into cloud computing, ultimately delivering sustained growth and competitive advantage.
The Ansoff Matrix aids risk assessment by categorizing growth strategies from lowest to highest risk: market penetration, market development, product development, and diversification. This framework enables organizations to evaluate potential returns against risk levels systematically, with many companies using it to balance aggressive expansion with calculated market entry strategies, ultimately delivering more informed investment decisions.
Businesses prioritize market development over market penetration when current markets show saturation, limited growth potential, or intense competition that makes further expansion costly. This strategic shift proves valuable when companies possess strong product capabilities, untapped geographic regions exist, or demographic segments remain underserved, ultimately delivering diversified revenue streams and reduced market dependency risks.
The Ansoff Matrix adapts to digital marketing by applying its four quadrants to online channels: market penetration through SEO optimization and social media engagement, market development via targeted digital advertising to new demographics, product development through digital offerings like apps or online services, and diversification by entering new digital markets. This framework enables marketers to systematically evaluate digital opportunities, allocate resources strategically across platforms, and measure growth initiatives, with many companies finding that this structured approach delivers clearer ROI tracking and more focused campaign strategies.
Key metrics include revenue growth rates, market share expansion, customer acquisition costs, product development ROI, and time-to-market for new offerings. These KPIs enable organizations to track progress across market penetration, development, product development, and diversification strategies, with many companies finding that monitoring customer lifetime value, competitive positioning, and operational efficiency ultimately delivers strategic insights and sustainable competitive advantage.
The competitive landscape significantly influences Ansoff Matrix decisions by determining market saturation levels, competitor strengths, and barrier heights across each strategic quadrant. In highly competitive markets, companies often pivot toward product development or diversification strategies, while emerging markets with fewer competitors favor market penetration approaches, ultimately enabling organizations to identify strategic paths that minimize competitive threats while maximizing growth opportunities.
The Ansoff Matrix applies effectively to non-profits and social enterprises by adapting growth strategies to mission-driven contexts, focusing on expanding beneficiary reach, diversifying programs, entering new communities, and developing innovative service delivery methods. Organizations like healthcare foundations, educational non-profits, and community development enterprises use these frameworks to strategically scale impact, optimize resource allocation, and enhance operational efficiency while maintaining their core mission focus.
Companies pursuing diversification face significant challenges including unfamiliar market dynamics, resource allocation complexities, increased operational risks, cultural integration difficulties, and substantial capital requirements. These strategic moves often demand extensive market research, new skill development, and careful timing, with many organizations finding that successful diversification requires strong leadership alignment and patience for longer-term returns.
Businesses use the Ansoff Matrix to align marketing and operational strategies by matching resource allocation, messaging, and capabilities to each growth quadrant's specific requirements. Market penetration demands intensive marketing campaigns with existing operational capacity, while diversification requires substantial operational restructuring and exploratory marketing approaches, ensuring strategic coherence across all business functions and minimizing resource conflicts.
Customer feedback serves as critical market intelligence when selecting Ansoff Matrix strategies, providing insights into customer satisfaction, unmet needs, feature preferences, and market gaps. Through surveys, reviews, and behavioral data, organizations can validate market penetration opportunities, identify product development priorities, assess market development feasibility, and evaluate diversification risks, ultimately ensuring strategic decisions align with actual customer demand and market realities.
-
The Designed Graphic are very professional and classic.
-
Awesome presentation, really professional and easy to edit.