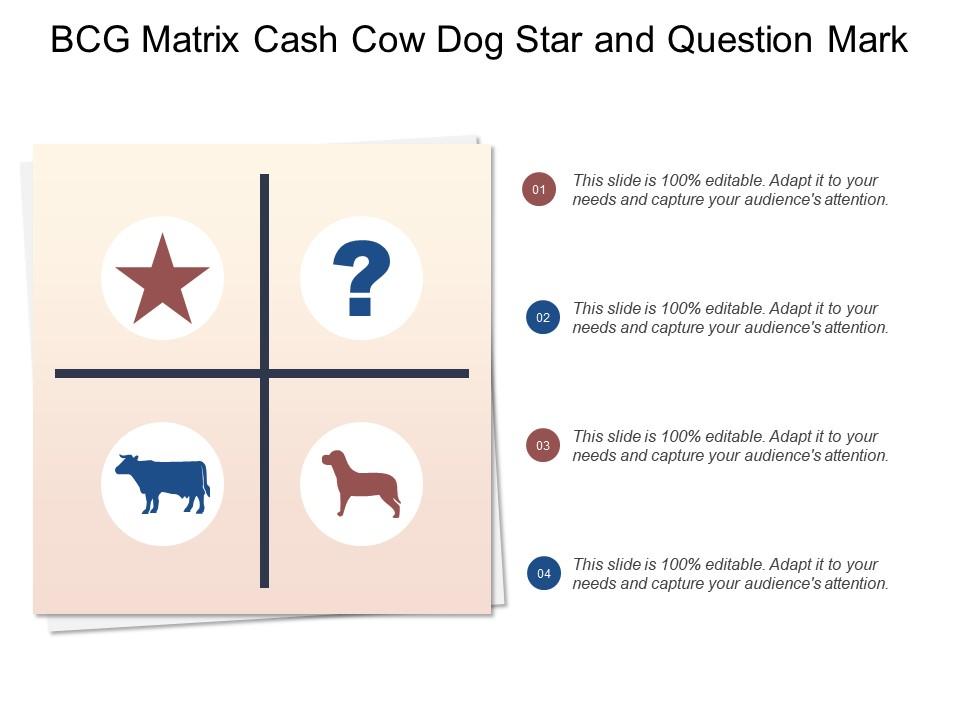
Bcg matrix displaying cash cow dog star and question mark
Try Before you Buy Download Free Sample Product
Audience
Editable
of Time
Folks consider you an excellent choice due to our Bcg Matrix Displaying Cash Cow Dog Star And Question Mark. Get elected to the helm of affairs.
People who downloaded this PowerPoint presentation also viewed the following :
Bcg matrix displaying cash cow dog star and question mark with all 5 slides:
Encourage a jovial approach with our Bcg Matrix Displaying Cash Cow Dog Star And Question Mark. Give folks a chance to experience humor.
FAQs for Bcg matrix displaying cash cow dog star
The BCG Matrix is a strategic planning tool that categorizes business units into four quadrants based on market growth and relative market share: Stars, Cash Cows, Question Marks, and Dogs. Strategic managers use this framework to allocate resources effectively, prioritize investments, and develop portfolio strategies, with many organizations finding that it streamlines decision-making processes and enhances long-term competitive positioning.
The BCG Matrix's four quadrants differ by market growth and market share: Stars (high growth, high share), Cash Cows (low growth, high share), Question Marks (high growth, low share), and Dogs (low growth, low share). These classifications enable strategic resource allocation across business portfolios, with companies leveraging Cash Cows to fund Stars while evaluating Question Marks for investment potential, ultimately optimizing competitive positioning.
Key factors include market growth rate, relative market share, competitive positioning, cash flow generation, and strategic resource requirements. These elements determine whether products become stars, cash cows, question marks, or dogs, with many organizations finding that accurate positioning enables better resource allocation, strategic investment decisions, and portfolio optimization for sustained competitive advantage.
The BCG Matrix enables businesses to strategically allocate resources by categorizing business units into Stars, Cash Cows, Question Marks, and Dogs based on market growth and share. This framework helps organizations prioritize investment in high-growth Stars, harvest cash from established Cash Cows, and divest underperforming Dogs, ultimately optimizing portfolio performance and maximizing returns.
Market growth rate serves as the vertical axis in the BCG Matrix, determining whether products fall into high-growth or low-growth categories alongside market share positioning. This metric helps organizations classify their portfolio into Stars, Question Marks, Cash Cows, and Dogs, with high-growth markets typically requiring greater investment and resources, while low-growth markets often generate steady cash flows for strategic reinvestment.
The BCG Matrix analyzes a company's product portfolio by plotting each product or business unit based on market growth rate and relative market share, categorizing them as Stars, Cash Cows, Question Marks, or Dogs. This strategic framework enables companies to make informed resource allocation decisions, identifying which products to invest in, maintain, or divest, ultimately optimizing portfolio performance and competitive positioning.
The BCG Matrix's limitations include oversimplified categorization, reliance on market share assumptions, static analysis ignoring market dynamics, and limited consideration of synergies between business units. These constraints can lead organizations to make hasty divestment decisions or underinvest in emerging opportunities, with many companies finding that complementing BCG analysis with additional strategic frameworks delivers more comprehensive insights.
Companies can address "Dogs" through divestiture, cost reduction strategies, niche market repositioning, or strategic bundling with higher-performing products to extract remaining value. Many organizations find that streamlining operations around these low-growth, low-share products, or divesting them entirely, frees up resources for investment in "Stars" and "Cash Cows," ultimately enhancing overall portfolio performance.
The BCG Matrix integrates seamlessly with SWOT analysis, Porter's Five Forces, and value chain analysis to create comprehensive strategic frameworks. While the BCG Matrix categorizes business units by market position, combining it with these tools enables organizations to assess competitive dynamics, internal capabilities, and market opportunities simultaneously, ultimately delivering more nuanced resource allocation decisions and strategic clarity.
The BCG Matrix aids market entry and exit decisions by revealing portfolio gaps where Stars or Question Marks could be developed, while identifying Dogs that drain resources and should be divested. This strategic analysis enables companies to reallocate capital from underperforming units to high-growth opportunities, with many organizations finding that systematic portfolio evaluation streamlines expansion decisions and enhances competitive positioning.
Companies like Apple have successfully used the BCG Matrix, positioning iPhones as cash cows, iPads as question marks transitioning to stars, and discontinuing products like iPod Classic. Similarly, Coca-Cola treats its flagship cola as a cash cow while investing in emerging health beverages, and Amazon strategically developed AWS from a question mark into a major star, demonstrating how the matrix guides resource allocation for sustainable growth.
Digital transformation has enhanced BCG Matrix application through real-time data analytics, AI-powered market analysis, and dynamic portfolio tracking that enables faster strategic pivots. Modern businesses leverage cloud platforms, predictive modeling, and automated reporting to continuously monitor cash flows and market positions, with companies like Netflix and Amazon demonstrating how digital tools transform traditional portfolio management into agile, data-driven strategic frameworks.
Businesses should use market growth rate and relative market share as the primary metrics for BCG Matrix placement, typically measuring annual market growth percentages and comparing their product's market share to the largest competitor. While market growth above 10% generally indicates high growth, companies increasingly incorporate additional factors like profitability trends, competitive positioning, and strategic alignment, ultimately delivering more nuanced portfolio decisions for resource allocation.
Companies should revisit BCG Matrix analyses quarterly or bi-annually, depending on market volatility and industry dynamics, with technology and consumer goods sectors requiring more frequent reviews. Regular reassessment enables organizations to identify shifting product positions, reallocate resources strategically, and maintain competitive advantage, ultimately ensuring portfolio decisions align with evolving market conditions and business objectives.
Visual presentation templates enhance BCG Matrix discussions by providing clear quadrant layouts, standardized product positioning, and interactive elements that facilitate strategic dialogue among stakeholders. These templates streamline complex portfolio analysis through color-coded categorizations, dynamic data visualization, and collaborative frameworks, with many strategy teams finding that structured visual formats accelerate decision-making and ensure comprehensive evaluation of business units.
No Reviews