

Market attractiveness and competitive strength matrix


Try Before you Buy Download Free Sample Product
 Impress Your
 Audience
Editable
of Time


Our Market Attractiveness And Competitive Strength Matrix are topically designed to provide an attractive backdrop to any subject. Use them to look like a presentation pro.
People who downloaded this PowerPoint presentation also viewed the following :
Content of this Powerpoint Presentation
Description:
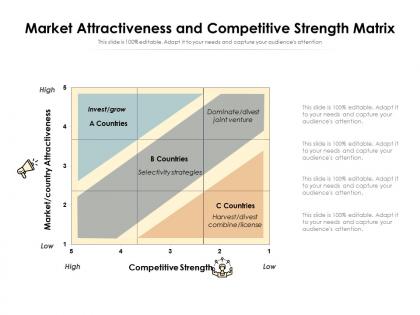
The image shows a PowerPoint slide titled "Market Attractiveness and Competitive Strength Matrix." This strategic tool is used to evaluate potential markets based on two dimensions: Market/Country Attractiveness and Competitive Strength.
The matrix is divided into four quadrants:
1. Upper-Left Quadrant (A Countries):
Represents markets with high attractiveness and high competitive strength. The strategy recommended here is to "Invest/grow," suggesting that companies should focus their resources on these markets to maximize returns.
2. Upper-Right Quadrant:
Indicates markets with high attractiveness but lower competitive strength. The suggested strategy is to "Dominate/divest joint venture," which implies that a company should either seek to become the market leader or consider forming joint ventures or divesting if dominance isn't feasible.
3. Lower-Left Quadrant (B Countries):
Shows markets with lower attractiveness but higher competitive strength. The "Selectivity strategies" recommendation suggests a more careful approach, selecting niche segments where the company can compete effectively.
4. Lower-Right Quadrant (C Countries):
Consists of markets with both low attractiveness and low competitive strength. The strategy here is to "Harvest/divest combine/license," meaning the company should consider harvesting any remaining value or divesting from these markets, and possibly exploring licensing or combining efforts with others.
Each quadrant is associated with a numeric scale along the axes:
1 to 5 for Market Attractiveness (from low to high) and 1 to 5 for Competitive Strength (from low to high). The slide indicates that it is "100% editable," allowing users to customize the content according to their specific analysis and market conditions.
Use Cases:
This matrix can be utilized across various industries:
1. Consumer Goods:
Use: Assessing different regional markets for product expansion.
Presenter: Market Analyst
Audience: Marketing team, strategy planners
2. Pharmaceuticals:
Use: Evaluating market entry for new drugs.
Presenter: Business Development Manager
Audience: Executives, R&D staff
3. Technology:
Use: Strategic planning for new technology product launches.
Presenter: Product Manager
Audience: Management, product development teams
4. Automotive:
Use: Deciding on manufacturing and sales investments in global markets.
Presenter: International Business Strategist
Audience: Corporate leadership, investors
5. Banking:
Use: Analyzing new regions for branch expansion or digital banking services.
Presenter: Strategic Planning Director
Audience: Bank executives, regional managers
6. Energy:
Use: Planning for investment in renewable energy projects across different countries.
Presenter: Chief Investment Officer
Audience: Investment team, sustainability officers
7. Hospitality:
Use: Determining where to acquire, build, or divest hotel properties.
Presenter: VP of Development
Audience: Real estate development team, finance analysts
Market attractiveness and competitive strength matrix with all 2 slides:
Use our Market Attractiveness And Competitive Strength Matrix to effectively help you save your valuable time. They are readymade to fit into any presentation structure.

FAQs for Market attractiveness and
Honestly, it boils down to three things that need to click together. First, know your audience inside out - like, their real problems, not just "millennials aged 25-35" nonsense. Figure out what actually makes you different from everyone else (and "better customer service" doesn't count). Then connect those two with messaging that hits home. The sweet spot is when your unique thing matters most to your specific people. I'd start by mapping their journey and see where your differences actually matter to them. Short sentences work. But you also want some flow when explaining the bigger picture, you know?
Start by figuring out who you're really up against - map your direct competitors and compare stuff like market share, pricing, and how customers actually rate them. Customer surveys are honestly the best way to do this because wow, sometimes the gap between how we think we're doing vs. reality is... rough. Dig into their marketing messages and product features too. SEMrush or tools like that can show you their keyword game and digital presence. Oh, and don't skip reading their customer reviews - that's where the real tea is. Just be ready to face some hard truths about where you actually stand.
Here's how I'd think about it - customer perception IS your market position, even if that's not what you intended. Your fancy strategy means nothing if people see you totally different. I learned this the hard way once! What customers think about your pricing, product, whatever - that's what drives their buying decisions. Survey your current customers and ask how they'd describe you to a friend. Might be eye-opening. Their answers show you where you actually stand versus where you think you do. Research what they really think regularly. Perceptions shift and you don't want to miss it.
Honestly, you gotta test your positioning with real people before going all-in. Run some surveys or quick interviews - see if customers actually understand what makes you different. I've seen so many "genius" ideas from boardroom brainstorms that totally bombed with actual users lol. The feedback will show you where there's a disconnect between your vision and reality. Maybe your messaging needs work, or your benefits aren't hitting right. Sometimes you'll need to completely rethink things. Start small though - try A/B testing different positioning on your website or ads first.
Dude, digital marketing is a game changer for brand positioning. Small companies can actually compete with giants now - wild, right? You get to target crazy specific audiences and test messaging on the fly instead of just guessing what works. Social media's pretty amazing for showing your brand's personality too. But here's the thing - everyone's jumped on this bandwagon. It's loud as hell out there. Honestly? Don't spread yourself thin trying to be everywhere. Pick maybe two platforms where your people actually spend time and focus there. Way better than shouting into the void on five different channels.
Look for the spaces where big companies aren't even bothering to compete. Find gaps in what they offer or customer groups they're totally ignoring. Like maybe they're obsessed with huge enterprise deals while small businesses desperately need something way simpler - you know what I mean? Don't try beating them at their own game. Instead, become THE go-to expert for that specific problem. You can move and change direction so much faster than they can (that's honestly your biggest advantage). Better to be the obvious choice for your niche than just another cheaper option in theirs.
Honestly? Most companies just go way too hard, way too fast. They'll ditch everything that actually worked and then wonder why their loyal customers are pissed off. Plus nobody does proper research - like they assume they know what people want but they're completely wrong lol. Your internal team also needs to be on the same page or you're screwed from day one. I'd say test small changes first. See what sticks. Don't blow up your whole brand identity overnight because that rarely ends well.
Look, when everyone's selling basically the same thing, you've gotta give people a real reason to pick you. Could be better quality, killer customer service, or just telling your story in a way that clicks. I've watched tons of businesses crush it by being amazing at ONE thing instead of trying to do everything (honestly, the "jack of all trades" approach rarely works anymore). Your difference has to actually matter to customers though - being weird just to be different is pointless. Figure out what advantage you can truly own and go all in on it.
So honestly, you need both the touchy-feely stuff and the hard numbers. Brand awareness surveys show how people actually see you vs competitors. Then track your market share, customer acquisition costs, pricing power - that's where you'll know if it's really working or just looks pretty on paper. Social listening is clutch too, sometimes better than those formal surveys tbh. Oh and don't go crazy measuring everything - pick like 2-3 key things monthly. I made that mistake once and got totally overwhelmed with data.
Dude, cultural context is everything when it comes to how people see your product's value and status. What looks super premium in the US might come off as cheap or weird somewhere else - I've watched brands totally bomb because of this. You gotta dig into local preferences first. Communication styles matter too, plus all the cultural symbols and even color choices can flip your brand perception upside down. Honestly, your best move is finding local research teams who actually know the market. They'll tell you straight up if you're nailing it or accidentally being offensive.
Honestly, you've gotta watch your consumer data like a hawk and jump on trends early. Test new messaging with tiny audience segments first - way less risky than going big right away. Your best moves? Reposition those brand benefits to match what people actually care about now, team up with influencers who get the vibe, and tweak your pricing or features accordingly. Sometimes you'll realize your whole target audience needs a complete overhaul (been there!). Don't be scared to experiment though. I'd set up quarterly reviews to check if you're still hitting the mark.
Dude, stories are everything for positioning. Like, you can claim you're "innovative" till you're blue in the face, but nobody cares. Tell them about your team pulling an all-nighter to solve some impossible customer problem? Now that's proof. Abstract positioning is just marketing fluff without stories backing it up. People need something real to grab onto - something that hits them emotionally. That's honestly how positioning actually sticks instead of going in one ear and out the other. I'd start with maybe 2-3 solid stories that show off your main strengths. Makes all the difference.
Honestly, you've got to nail your segments before you even think about positioning. I learned this the hard way - tried to speak to "everyone" once and it was a disaster. Segmentation is like figuring out who's actually listening, then positioning is how you talk to each group. Without knowing your audience, you'll end up with bland messaging that nobody cares about. Pick 2-3 solid segments max (don't go crazy here) and create specific positioning for each one. The more focused your segments are, the sharper your positioning gets. Trust me on this one.
Your positioning should basically drive every product call you make. Before building anything, ask: does this actually fit what we want to be known for? Like if you're going for "premium quality," don't rush out buggy features - that's just shooting yourself in the foot. I've watched companies build genuinely cool stuff that completely went against their positioning. Use it to prioritize features and guide design choices. Oh, and make sure your product team gets the positioning first - otherwise you're just wasting time in sprint reviews trying to fix things after the fact.
Your customers are basically telling you if your positioning actually works or if you're living in fantasy land. Survey them regularly about how they see your brand vs competitors - what problems you actually solve, how they'd describe you to others. I've watched companies think they're the "premium solution for busy executives" while customers are out there comparing them to budget tools. That disconnect is brutal. Use their feedback to adjust your messaging before you drift too far from reality. Sometimes they value completely different benefits than what you expected, which honestly happens more often than you'd think.
No Reviews