


BCG Matrix To Analyse Apples Product Line How Apple Became Competent Branding SS V




Try Before you Buy Download Free Sample Product
 Impress Your
 Audience
 100%
100% Editable
 Save Hours
 of Time


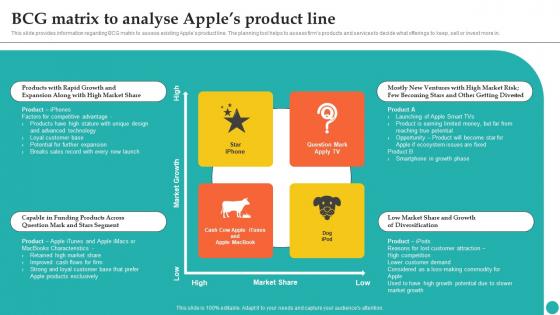
This slide provides information regarding BCG matrix to assess existing Apples product line. The planning tool helps to assess firms products and services to decide what offerings to keep, sell or invest more in.
People who downloaded this PowerPoint presentation also viewed the following :
BCG Matrix To Analyse Apples Product Line How Apple Became Competent Branding SS V with all 6 slides:
Use our BCG Matrix To Analyse Apples Product Line How Apple Became Competent Branding SS V to effectively help you save your valuable time. They are readymade to fit into any presentation structure.





FAQs for BCG Matrix To Analyse Apples Product Line How Apple Became Competent
So the BCG Matrix is basically this tool where you map out your products based on market growth and how much market share you've got. Each product falls into one of four categories - cash cows, stars, question marks, or dogs. Pretty weird names, I know. Cash cows are your moneymakers that don't need much investment. Stars are growing fast and doing well. Question marks might be worth investing in, or they might flop. Dogs? Yeah, those are probably dead weight. It helps you decide where to put your money and what to cut loose.
So the four quadrants just sort your products by market growth vs your market share. Stars? Those are crushing it - high growth AND high share, but damn they're expensive to maintain. Question Marks sit in hot markets where you barely have any presence yet. Cash Cows are boring but beautiful - you dominate these slow markets and they fund everything else. Dogs are the nightmare combo: weak growth with weak share. Most companies keep way too many dogs around honestly. Pour money into stars and decent question marks, then ride those cash cows hard.
Yeah totally! Works great for B2B, tech, healthcare, nonprofits - pretty much anything. You just gotta tweak what "market share" and "growth" actually mean for whatever you're analyzing. Like software companies might track user growth instead of traditional sales metrics. I've honestly seen it work even better for B2B than consumer stuff because the data's usually less messy. Manufacturing companies use it all the time for different product lines or regions. The trick is nailing your market definition upfront though - get that wrong and your whole analysis is basically useless.
So basically you want to track two key things: how fast your market's growing and where you stack up against competitors. Industry growth shows if things are expanding or flat. Your relative market share reveals how you're doing versus the biggest player - though honestly, getting solid competitor data is such a headache sometimes. Also factor in what stage your product's at in its lifecycle and how competitive things are getting. Cash flow matters too - is this thing generating money or eating it up? Start with your sales numbers and any industry reports you can find, that's your base to work from.
Honestly, I'd do it at least once a year, but that's kinda the bare minimum. Fast-moving industries? Quarterly makes way more sense. Don't just stick to some rigid schedule though – if a major competitor drops something big or the economy shifts, jump on a fresh analysis right away. Your cash cows might start looking shaky, or those question marks could suddenly show real promise. Set up regular check-ins but stay flexible enough to dig deeper when things change. Market reality beats calendar dates every time.
The BCG Matrix is pretty narrow - it only considers market growth and market share, which misses so much important stuff. What about profit margins, customer loyalty, or how competitive the industry actually is? Also, having high market share doesn't automatically mean you're profitable anymore (learned that one the hard way in a previous job). Those four boxes make complex businesses look way too simple. Synergies between different business units? Nope, doesn't factor that in either. It's useful as a starting point, I guess, but you'll definitely need other analysis tools and some good old-fashioned qualitative thinking before making big decisions.
Market changes mess with your BCG Matrix big time. Your Stars can turn into Dogs super fast when markets crash - or the other way around if things take off. Competitors jumping in will eat away at your market share, which sucks because it can knock your Cash Cows down to Dog status. Economic downturns are brutal too - they slow growth and make those Question Marks way harder to justify spending money on. Honestly, you've gotta update your positioning constantly based on what's happening now, not old data from last year.
So the BCG Matrix is pretty straightforward - it sorts your products into four categories to help with budgeting decisions. Stars are your goldmine since they're growing fast in hot markets, so throw money at those. Cash Cows give you steady income without much investment. Question Marks are tricky - you've gotta decide if they're worth fixing or just cutting loose. Dogs are usually money pits, honestly. What I like about it is you get this clear visual of your whole product lineup at once. Makes it super obvious which ones deserve more cash versus which ones are just draining your budget. Perfect starting point for those fun budget meetings lol.
Dude, you definitely need competitive analysis for the BCG Matrix to work right. How else would you figure out your actual market share position? I've seen companies think they're killing it when they're really just... not. Map out where competitors stand first - their market shares, growth rates, all that stuff. Then you can actually tell if your product's a "Star" or if you're just being optimistic. Without this context, you're basically guessing which quadrant things belong in. And honestly? That's how you end up throwing money at the wrong products. Been there.
So here's what I'd do - plot your products on the BCG matrix first, then run SWOT analysis on each quadrant. It's wild how much clearer things get when you combine them. BCG tells you the financial story, but SWOT explains the actual reasons behind performance. Like, why are your Cash Cows making money? What threats could knock them down? Your Question Marks probably have crazy opportunities you're missing. Start with your biggest Cash Cow and really dig into its weaknesses - I bet you'll find some stuff about market saturation that's been staring you in the face. Pretty uncomfortable but super useful.
Apple's the classic case study here - they milked iPod profits to bankroll iPhone development. Smart move. GE went all-in with this approach too, ditching their appliance business (total dogs) to focus on growth sectors. Coca-Cola's been doing it forever since their main product basically prints money. Oh, and Amazon used their retail profits to build AWS, which is genius when you think about it. The key is shifting cash from your boring-but-profitable stuff into whatever's gonna be your next big thing. Works pretty well if you can actually identify what's worth investing in.
So you'll want to swap out those traditional metrics for digital ones - think active users, downloads, subscription rates instead of plain market share. Growth rates? Look at user acquisition trends in your space. The four boxes still totally work though. Stars are your killer apps, Cash Cows might be those boring but reliable legacy platforms everyone still uses. Question Marks are experimental features (honestly half of them will probably flop), and Dogs are whatever outdated tools you're still maintaining for some reason. Just start mapping with engagement data instead of only looking at revenue numbers.
So you need market share versus your biggest competitor (that's your x-axis) and the market growth rate for the y-axis. The tricky part? Don't just use your regular market share - divide yours by the leader's share to get the relative number. Growth rate is just the industry's annual percentage. Oh, and bubble size comes from revenue data for each product. I learned this the hard way but seriously - don't mix up your time periods. Using quarterly data for one thing and annual for another will mess everything up. Most people screw up that relative market share calculation though.
So basically, your product's age totally dictates where it sits on the BCG Matrix. Most new stuff starts as Question Marks - you've got low market share but decent growth potential. The winners eventually become Stars when they grab share in growing markets. Cash Cows are those boring but reliable products that have been making money forever in stable markets. Dogs are the sad ones - either they never took off or they're old Stars whose markets died. Honestly, the hardest part is knowing when to kill off the Dogs so you can fund your next big thing.
Question Marks are tricky - you've got two real options here. Either go all-in with marketing and R&D to grab market share, or just cut your losses if it looks hopeless. Thing is, these products are bleeding cash right now even though they're in growing markets. I'd set some hard deadlines and milestones, then watch closely to see if you can push them into Star status. But honestly? A lot of them just don't make it no matter what you throw at them. Be brutal about your competitive position - if you're not gaining ground after a reasonable timeline, time to bail.
-
A fantastic collection of templates. I'll likely use this as my go-to resource for future templates and support.
-
Thank you for showering me with discounts every time I was reluctant to make the purchase.