

Big Data Ppt Powerpoint-Präsentationsfolien





Try Before you Buy Download Free Sample Product
 Impress Your
Audience
 100%
Editable
 Save Hours
of Time


Big Data hat eine Revolution im Bereich der Informationstechnologie ausgelöst. Unsere inhaltsfertigen PPT PowerPoint-Präsentationsfolien für Big Data geben Aufschluss über die Bedeutung und Relevanz großer Datenmengen. Die Präsentation zum Datenmanagement umfasst eine Vielzahl von Themen wie Big Data-Quellen, Marktprognose, 3 Vs, Technologien, Workflow, Datenanalyseprozess, Auswirkungen, Nutzen, Zukunft, Chancen und Herausforderungen sowie viele zusätzliche Folien mit Grafiken und Diagrammen. Der größte Vorteil dieser Präsentationsvorlage für Big Data-Analysen besteht darin, dass Sie die Informationen ermitteln können, mit denen Sie die Zukunft Ihres Unternehmens gestalten können. Darüber hinaus können diese Designs auch verwendet werden, um Ihre eigene Präsentation zu Predictive Analytics, Datenverarbeitungsanwendungen, Datenbank, Cloud Computing, Business Intelligence und Benutzerverhaltensanalysen zu erstellen. Laden Sie Big-Data-PPT-Grafiken herunter, mit denen Sie genaue Geschäftsentscheidungen treffen können. Informieren Sie Betrüger über unsere Big Data Ppt Powerpoint-Präsentationsfolien. Überzeugen Sie sie davon, sehr aufmerksam zu sein.
People who downloaded this PowerPoint presentation also viewed the following :
Inhalt dieser Powerpoint-Präsentation
Folie 1 : Diese Folie stellt Big Data PPT vor – Was ist BIG DATA? Geben Sie Ihren Firmennamen an und legen Sie los.
Folie 2 : Dies ist eine Agenda-Folie. Geben Sie hier Ihre Agenden an.
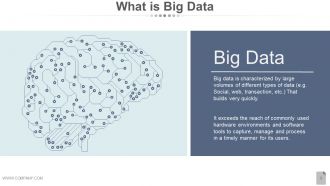
Folie 3 : Diese Folie zeigt, was Big Data mit seiner Definition ist.
Folie 4 : Diese Folie präsentiert Big Data-Fakten – Wie groß Big Data ist, in tabellarischer Form.
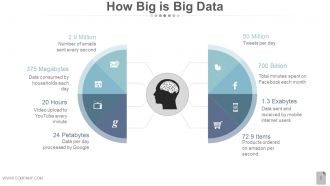
Folie 5 : Diese Folie zeigt auch, wie groß Big Data ist, mit Beispielen wie: Pro Sekunde bestellte Produkte, Von mobilen Internetnutzern gesendete und empfangene Daten, Tweets pro Tag, Gesamtzahl der monatlich auf Facebook verbrachten Minuten, Anzahl der pro Sekunde gesendeten E-Mails, Von Haushalten täglich verbrauchte Daten, von Google verarbeitete Daten pro Tag, Video-Upload auf YouTube jede Minute.
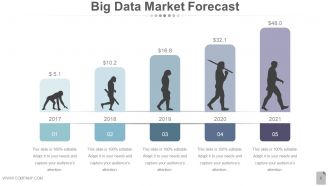
Folie 6 : Diese Folie präsentiert die Big-Data-Marktprognose für eine bestimmte zu bewertende Dauer (Jahre/Monate).
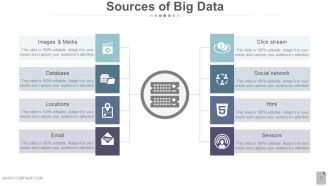
Folie 7 : Diese Folie präsentiert Big Data-Quellen mit den folgenden Punkten – Bilder & Medien, Sensoren, Click Stream, Soziales Netzwerk, Html, E-Mail, Standorte, Datenbank.
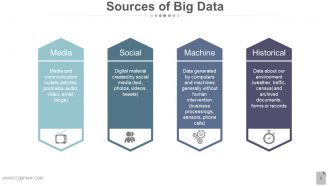
Folie 8 : Diese Folie zeigt auch Quellen von Big Data mit den folgenden Punkten: Medien: Medien und Kommunikationskanäle (Artikel, Podcasts, Audio, Video, E-Mail, Blogs) Sozial: Von sozialen Medien erstelltes digitales Material (Text, Fotos, Videos, Tweets) Maschine: Daten, die von Computern und Maschinen im Allgemeinen ohne menschliches Eingreifen generiert werden (Geschäftsprozessprotokolle, Sensoren, Telefonanrufe) Historisch: Daten über unsere Umgebung (Wetter, Verkehr, Volkszählung) und archivierte Dokumente, Formulare oder Aufzeichnungen
Folie 9 : Diese Folie zeigt 3 Vs Big Data-Volumen: Terabyte, Datensätze, Transaktionen, Tabellen, Dateien. Vielfalt: Batch, Near Time, Semistrukturiert, Streams. Geschwindigkeit: Strukturiert, Unstrukturiert, Semistrukturiert.
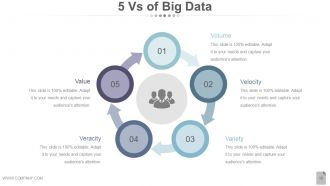
Folie 10 : Diese Folie präsentiert 5 Vs von Big Data. Sie sind - Volumen, Geschwindigkeit, Vielfalt, Wahrhaftigkeit, Wert.
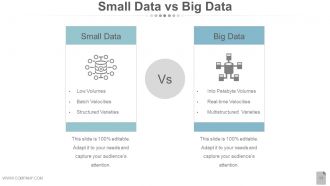
Folie 11 : Diese Folie präsentiert Small Data vs. Big Data. KLEINE DATEN (kleine Volumina, Batch-Geschwindigkeiten, strukturierte Varianten) BIG DATA (in Petabyte-Volumen, Echtzeit-Geschwindigkeiten, multistrukturierte Varianten).
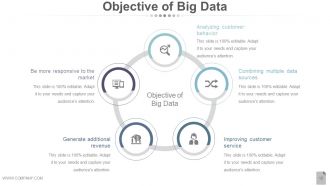
Folie 12 : Diese Folie präsentiert Ziele von Big Data wie: Analyse des Kundenverhaltens, Kombination mehrerer Datenquellen, Verbesserung des Kundenservice, Generierung zusätzlicher Einnahmen, Reaktionsfähigkeit auf den Markt.
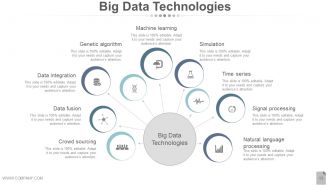
Folie 13 : Diese Folie präsentiert Big Data-Technologien mit den folgenden Punkten – Big Data-Technologien, Crowd Sourcing, Datenfusion, Datenintegration, Maschinelles Lernen, Simulation, Genetischer Algorithmus, Verarbeitung natürlicher Sprache, Signalverarbeitung, Zeitreihen.
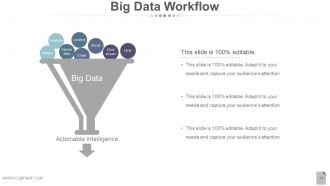
Folie 14 : Diese Folie zeigt den Big Data-Workflow mit den folgenden Inhalten – Big Data, E-Mail, Click Stream, Html, Social, Location, Database, Sensor Data, Images, Actionable Intelligence.
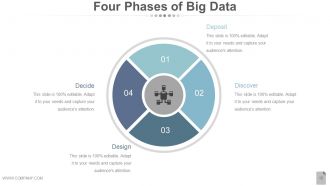
Folie 15 : Diese Folie stellt vier Phasen von Big Data vor. Die aufgelisteten sind: Einzahlung, Entdecken, Entwerfen, Entscheiden.
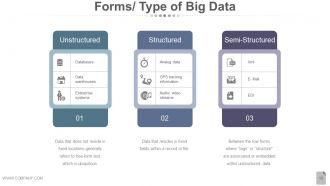
Folie 16 : Diese Folie zeigt Formulare/Typen von Big Data unstrukturiert: Daten, die sich nicht an festen Orten befinden, beziehen sich im Allgemeinen auf freien Text, der allgegenwärtig ist. Strukturiert: Daten, die sich in festen Feldern innerhalb eines Datensatzes oder einer Datei befinden. Semi-strukturiert: Zwischen den beiden Formularen, in denen „Tags“ oder „Struktur“ verknüpft oder in unstrukturierte Daten eingebettet sind.
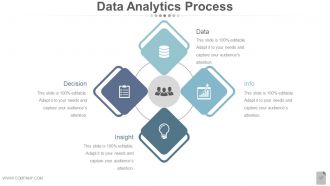
Folie 17 : Diese Folie präsentiert den Datenanalyseprozess mit den folgenden Unterüberschriften – Entscheidung, Daten, Einblick, Info.
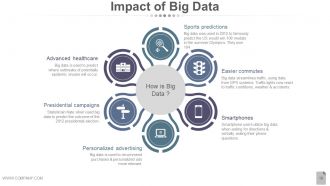
Folie 18 : Diese Folie zeigt die Auswirkungen von Big Data mit den folgenden Punkten: Wie ist Big Data? Sportvorhersagen, einfacheres Pendeln, Smartphones, personalisierte Werbung, Präsidentschaftskampagnen, fortschrittliches Gesundheitswesen.
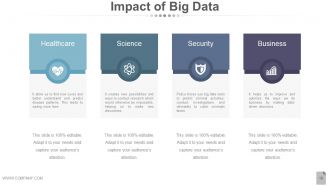
Folie 19 : Diese Folie zeigt die Auswirkungen von Big Data in den folgenden Sektoren – Gesundheitswesen, Wissenschaft, Sicherheit, Unternehmen.
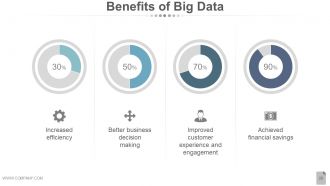
Folie 20 : Diese Folie zeigt die Vorteile von Big Data wie: Bessere Entscheidungsfindung im Unternehmen, Verbesserte Kundenerfahrung und -bindung, Erzielte finanzielle Einsparungen, Erhöhte Effizienz.
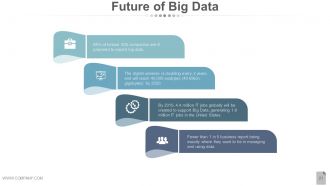
Folie 21 : Auf dieser Folie wird die Zukunft von Big Data gezeigt.
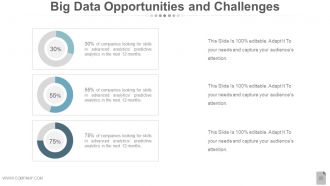
Folie 22 : Diese Folie präsentiert Chancen und Herausforderungen für Big Data. Geben Sie sie hier an.
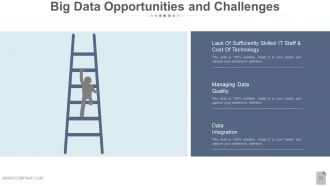
Folie 23 : Diese Folie stellt Chancen und Herausforderungen für Big Data vor, wie z. B. Mangel an ausreichend qualifiziertem IT-Personal und Technologiekosten, Verwaltung der Datenqualität, Datenintegration.
Folie 24 : Diese Folie trägt den Titel Zusätzliche Folien, um vorwärts zu gehen. Sie können den Folieninhalt nach Bedarf ändern/ändern.
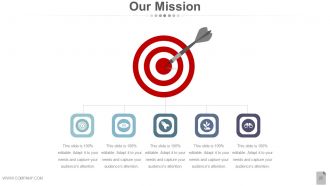
Folie 25 : Dies ist unsere Mission Folie. Staatliche Firmenmission hier.
Folie 26 : Dies ist die Folie unseres Teams mit Namen, Bezeichnung und Bildfeldern.
Folie 27 : Dies ist eine Über uns-Folie. Geben Sie hier Team-/Firmenspezifikationen an.
Folie 28 : Diese Unser Ziel-Folie. Staatsziele etc. hier.
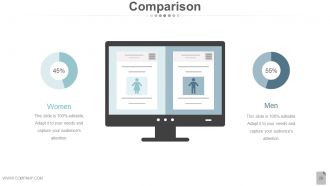
Folie 29 : Dies ist eine Vergleichsfolie zum Vergleich von Entitäten/Produkten usw. hier.
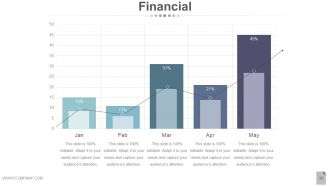
Folie 30 : Dies ist eine Folie zum Finanzergebnis. Staatsfinanzielle Aspekte etc. hier.
Folie 31 : Dies ist eine Zitate-Folie, um Unternehmensbotschaften, Überzeugungen usw. zu vermitteln. Sie können den Inhalt der Folie nach Bedarf ändern.
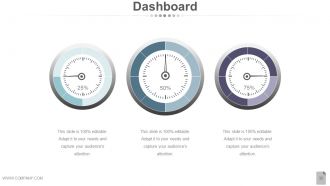
Folie 32 : Dies ist eine Dashboard-Folie zur Angabe von Metriken, KPIs usw.
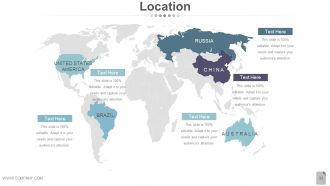
Folie 33 : Dies ist eine Standortfolie des Weltkartenbilds, um die globale Präsenz, das Wachstum usw.
Folie 34 : Dies ist eine Timeline-Folie, die Entwicklung, Wachstum, Meilensteine usw. zeigt.
Folie 35 : Dies ist eine Post-It-Folie zum Markieren von Ereignissen, wichtigen Informationen usw.
Folie 36 : Dies ist eine Zeitungsfolie zur Anzeige von Nachrichten, Ereignissen usw. Sie können den Folieninhalt nach Bedarf ändern.
Folie 37 : Dies ist eine Puzzle-Bildfolie zur Anzeige von Informationen, Spezifikationen usw.
Folie 38 : Dies ist eine Zielbildfolie. Landesziele usw. hier.
Folie 39 : Dies ist eine kreisförmige Bildfolie zur Anzeige von Informationen, Spezifikationen usw.
Folie 40 : Dies ist eine Venn-Diagramm-Bildfolie zur Anzeige von Informationen, Spezifikationen usw.
Folie 41 : Dies ist eine Mindmap-Bildfolie zur Anzeige von Informationen, Spezifikationen usw.
Folie 42 : Dies ist eine Matrixfolie zur Anzeige von Informationen, Spezifikationen usw.
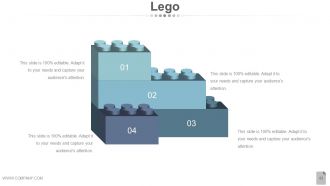
Folie 43 : Dies ist eine Lego-Bildfolie zur Anzeige von Informationen, Spezifikationen usw.
Folie 44 : Dies ist eine Silhouettes-Bildfolie, um Informationen, Spezifikationen usw. anzuzeigen.
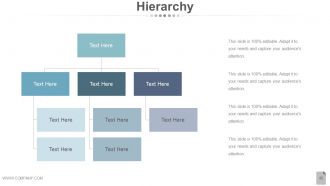
Folie 45 : Dies ist eine Hierarchiebildfolie zur Anzeige von Informationen, Spezifikationen usw.
Folie 46 : Dies ist eine Glühbirnen-/Ideenbildfolie, die Informationen, Spezifikationen, innovative Aspekte usw. zeigt.
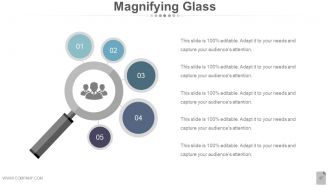
Folie 47 : Dies ist eine Lupenbildfolie zur Anzeige von Informationen, Spezifikationen usw.
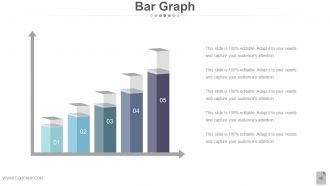
Folie 48 : Dies ist eine Balkendiagramm-Bildfolie zum Anzeigen von Produkt-/Entitätsvergleichen, Informationen usw.
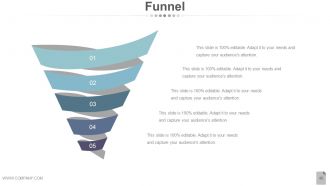
Folie 49 : Dies ist eine Trichterbildfolie zur Anzeige von Informationen, Spezifikationen usw.
Folie 50 : Dies ist eine Dankesfolie mit Adresse# Hausnummer, Stadt, Bundesland, Kontaktnummern, E-Mail-Adresse.
Big Data Ppt Powerpoint-Präsentationsfolien mit allen 50 Folien:
Reduzieren Sie den Journalismus mit unseren Big Data Ppt Powerpoint-Präsentationsfolien. Stellen Sie sicher, dass das Problem leicht zu lösen ist.









FAQs for Big Data Ppt
So basically you've got your data ingestion stuff like Kafka, storage (Hadoop HDFS or whatever cloud thing you're using), and processing engines like Spark. Then there's the analytics and visualization layers on top. Honestly, security and data governance are super boring but you can't skip them - learned that the hard way. Orchestration tools like Airflow keep your pipelines from breaking constantly. My advice? Map out what data you actually need flowing where first. Don't try building everything at once or you'll go crazy. Pick components that make sense for your specific situation.
So basically you need automated pipelines checking for duplicates and missing data as it comes in. Data profiling tools are a must - there's no way you're manually checking Big Data volumes, that's just insane. Most companies track data lineage so they can figure out where stuff went wrong. Oh and schema validation is huge too, keeps everything standardized. The trick is baking quality checks right into your ingestion process instead of scrambling later. Honestly, start with monitoring dashboards first. Your team will thank you when they catch issues before they spiral.
Honestly, ML is like having a really smart intern who never gets tired. You feed it your data and it starts finding patterns you'd never catch manually - or would take you months to spot. It predicts what customers will do, catches fraud, suggests products, all that good stuff. The best part? It actually gets smarter over time without you babysitting it. I'd say pick one problem first and see how it performs. Don't try to boil the ocean right away. Trust me, once you see it work on something small, you'll be hooked on scaling it up.
Big Data lets you slice up customers way better than just looking at age and gender stuff. You're digging into purchase history, what they click on, social media habits - all that good data. Machine learning can find weird segments you'd never guess, like "people who shop Sunday mornings after scrolling Instagram for 20 minutes" (I swear these algorithms are getting creepy good). Mix your sales data with how people actually behave across your website, emails, whatever. Honestly? Start with your biggest money-makers first. Figure out what makes those customers tick, then build campaigns around that.
Honestly, data quality problems will drive you crazy - that's the big one. Storage costs add up fast too if you're not careful. Good luck finding engineers who actually get this stuff, they're expensive and hard to find. Your current systems probably can't handle the data volume anyway, so integration becomes this whole mess. Security and compliance requirements are brutal depending on your industry (banking is the worst). Performance issues always hit at 3am when everything's processing. Start with something small first, get your data governance sorted early, and seriously budget like double what you think for engineering talent. Trust me on that last part.
So data lakes are basically like throwing everything into one giant messy pile - videos, spreadsheets, random sensor stuff, you name it. No organization needed upfront. Warehouses? Total opposite. You've gotta clean and structure everything before it goes in, like a super organized filing system. Here's the thing though - lakes let you dump anything but they're slower when you actually want to find something specific. Warehouses are crazy fast for queries but way less flexible. Honestly depends what you're prioritizing - do you want the flexibility to store weird data types, or do you need lightning-fast searches?
Okay so basically three big things you gotta watch out for: privacy, consent, and bias. Get proper consent before grabbing anyone's personal data - be upfront about what you're doing with it. Privacy-wise, anonymize whatever you can and don't hoard unnecessary stuff. The bias thing is honestly where most people screw up, even experienced folks. Your models will just repeat whatever discrimination exists in your training data if it's not representative enough. Always check your datasets for fairness across different groups. Oh, and definitely do a privacy impact assessment on your current projects first - you'll catch problems early instead of dealing with disasters later.
So predictive analytics is like having a crystal ball for your business data. It digs through all your historical info to spot patterns and predict what's coming next. Pretty cool stuff, honestly. Instead of just reacting to things after they happen, you can actually see which customers might bail, when sales will jump, or if your equipment's about to crap out. The algorithms catch trends you'd never notice buried in all that data. My advice? Don't go crazy trying to predict everything at once. Pick one specific problem you're dealing with and test it out there first.
Honestly, Spark's probably your go-to for big data stuff - handles both batch and streaming pretty smoothly. Hadoop still works but feels kinda outdated now. If you don't want the headache of managing servers, just go with cloud options like AWS EMR or BigQuery. Way less painful. Python with pandas is solid for smaller datasets, though I guess that's obvious. Databricks is nice if you need that collaborative workspace thing. Oh, and definitely figure out what you actually need first - I've seen people overcomplicate this so much. Start simple, then scale up if needed.
Honestly, big data is pretty clutch for supply chains. You get real-time views of your inventory, demand patterns, supplier performance - all that stuff. The predictive side is where it gets really interesting though. Instead of scrambling when you run out of stock, you can see it coming weeks ahead. Same with demand spikes from weather changes or whatever's trending. Route optimization saves you tons on shipping too. Oh, and you'll spot quality issues way earlier by watching supplier data trends. My advice? Don't go crazy trying to fix everything at once. Pick one headache - maybe inventory forecasting - and nail that first.
Honestly, visualization is a game changer when you're drowning in data. Your brain processes visual patterns way faster than scanning through spreadsheets - like, we're just wired that way. Heat maps are perfect for geographic stuff, while time series charts show trends over time. The trick is matching the right chart type to what story you're trying to tell. I used to just stare at numbers until my eyes crossed, but now? A good graph shows me outliers and relationships instantly. Way less painful than scrolling through endless rows of data.
Honestly, big data changes everything about making decisions. Instead of just going with your gut, you're working with actual evidence. The pattern recognition stuff is crazy - you can predict trends and really get inside your customers' heads. Marketing campaigns become way more targeted, and you're not wasting resources on random guesses anymore. Though I gotta say, you need someone who can actually read all those numbers, or you'll just end up more confused than when you started. It's like having superpowers, but only if you know how to use them.
Honestly, the whole compliance thing is such a headache but here's what works. Build privacy stuff into your system from the start - way easier than retrofitting later. Map out what data you're actually collecting first because you can't protect mystery data. Set up governance frameworks to classify sensitive info and control who sees what. GDPR and CCPA keep changing the rules which is super annoying. Automate compliance checks when you can, train your team regularly, and definitely loop in legal early. Oh, and keep audit trails for everything - regulators love their paper trails.
AI analytics and real-time processing are totally worth watching - they're changing everything right now. Edge computing is huge too since it processes data way closer to the source, so everything runs faster. The automation stuff honestly gets me most excited because who wants to do manual work all day? Privacy tools and data democratization are trending hard, which is great for getting non-tech people actually using insights. Oh, and definitely audit what you've got first - see where these fit in. That's probably the smartest starting point anyway.
Honestly? Just grab Google Analytics and mess around with Apache Spark first - no need to blow your budget on fancy enterprise stuff. Collect data you'll actually use, not every single thing you can track. AWS and Google Cloud are great since you only pay for what you need. Most startups I know collect tons of data then never look at it again lol. If you can't afford a data scientist yet, try partnering with local universities or check out Kaggle for talent. The whole trick is proving this stuff works before you go crazy with expensive infrastructure. Start small, see results, then scale up.
-
Good
-
Nice
-
Excellent design and quick turnaround.
-
Topic best represented with attractive design.