

Big Data Ppt Powerpoint Presentation Slides





Try Before you Buy Download Free Sample Product
 Impress Your
Audience
 100%
Editable
 Save Hours
of Time


Big Data ha supuesto una revolución en el campo de la tecnología de la información. Nuestras diapositivas de presentación de PowerPoint PPT de Big Data listas para el contenido arrojan luz sobre la importancia y relevancia de grandes volúmenes de datos. La presentación de gestión de datos cubre una gran variedad de temas como fuentes de big data, pronóstico de mercado, 3 V, tecnologías, flujo de trabajo, proceso de análisis de datos, impacto, beneficio, futuro, oportunidad y desafíos, y muchas diapositivas adicionales que contienen gráficos y tablas. El mayor beneficio que ofrece esta plantilla de presentación de análisis de big data es que le permite descubrir la información que se puede utilizar para dar forma al futuro de su negocio. Además, estos diseños también se pueden utilizar para crear su propia presentación sobre análisis predictivo, aplicaciones de procesamiento de datos, bases de datos, computación en la nube, inteligencia empresarial y análisis del comportamiento del usuario. Descargue elementos visuales PPT de big data que lo ayudarán a tomar decisiones comerciales precisas. Ilumine a la gente sobre el fraude con nuestras diapositivas de presentación de Powerpoint de Big Data Ppt. Convéncelos de estar muy alerta.
People who downloaded this PowerPoint presentation also viewed the following :
Contenido de esta presentación de Powerpoint
Diapositiva 1 : Esta diapositiva presenta Big Data PPT: ¿Qué es BIG DATA? Indique el nombre de su empresa y comience.
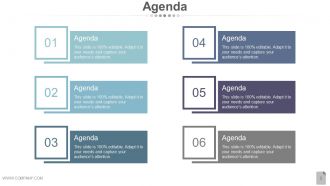
Diapositiva 2 : Esta es una diapositiva de Agenda. Exprese sus agendas aquí.
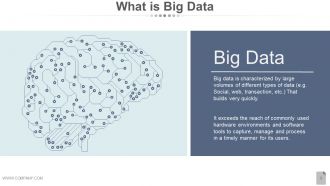
Diapositiva 3 : Esta diapositiva presenta Qué es Big Data con su definición.
Diapositiva 4 : Esta diapositiva presenta los hechos de Big Data: qué tan grande es Big Data en forma de lista en tabla.
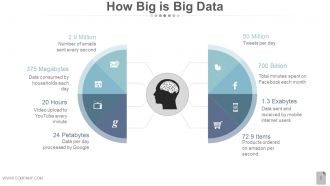
Diapositiva 5 : Esta diapositiva también presenta qué tan grande es Big Data con ejemplos como: Productos pedidos por segundo, Datos enviados y recibidos por usuarios de Internet móvil, Tweets por día, Total de minutos gastados en Facebook cada mes, Número de correos electrónicos enviados cada segundo, Datos consumidos por los hogares cada día, Datos por día procesados por Google, Subida de video a YouTube cada minuto.
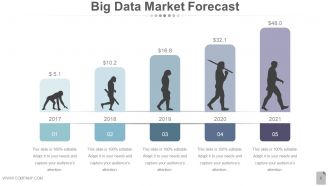
Diapositiva 6 : Esta diapositiva presenta el pronóstico del mercado de Big Data para una duración particular (años / meses) a evaluar.
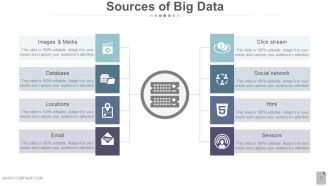
Diapositiva 7 : Esta diapositiva presenta las fuentes de Big Data con los siguientes puntos: imágenes y medios, sensores, flujo de clics, red social, html, correo electrónico, ubicaciones, base de datos.
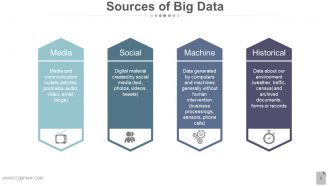
Diapositiva 8 : Esta diapositiva también muestra las Fuentes de Big Data con los siguientes puntos: Medios: Medios de comunicación y medios de comunicación (artículos, podcasts, audio, video, correo electrónico, blogs) Social: Material digital creado por las redes sociales (texto, fotos, videos, tweets) Máquina: datos generados por computadoras y máquinas generalmente sin intervención humana (registros de procesos comerciales, sensores, llamadas telefónicas) Histórico: datos sobre nuestro entorno (clima, tráfico, censo) y documentos, formularios o registros archivados
Diapositiva 9 : Esta diapositiva muestra 3 V de Big Data - Volumen: Terabytes, Registros, Transacciones, Tablas, archivos. Variedad: Lote, Tiempo cercano, Semiestructurado, Streams. Velocidad: estructurado, no estructurado, semiestructurado.
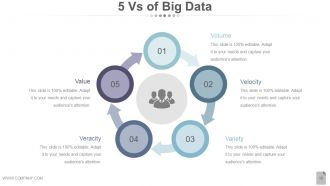
Diapositiva 10 : Esta diapositiva presenta 5 V de Big Data. Son: volumen, velocidad, variedad, veracidad, valor.
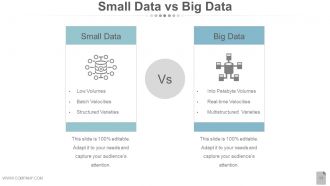
Diapositiva 11 : Esta diapositiva presenta Small Data Vs Big Data. PEQUEÑOS DATOS (Volúmenes bajos, Velocidades de lote, Variedades estructuradas) BIG DATA (En volúmenes de petabytes, Velocidades en tiempo real, Variedades multiestructuradas).
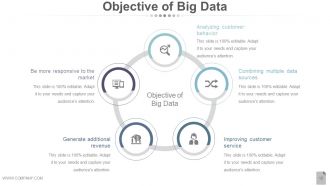
Diapositiva 12 : Esta diapositiva presenta el objetivo de Big Data, como: analizar el comportamiento del cliente, combinar múltiples fuentes de datos, mejorar el servicio al cliente, generar ingresos adicionales, ser más receptivo al mercado.
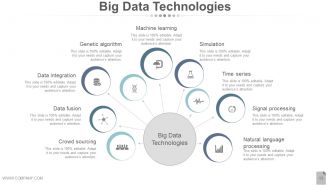
Diapositiva 13 : Esta diapositiva presenta las Tecnologías de Big Data con los siguientes puntos: Tecnologías de Big Data, Crowd sourcing, Fusión de datos, Integración de datos, Aprendizaje automático, Simulación, Algoritmo genético, Procesamiento del lenguaje natural, Procesamiento de señales, Series temporales.
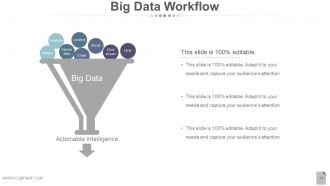
Diapositiva 14 : Esta diapositiva muestra el flujo de trabajo de Big Data con el siguiente contenido: Big Data, Correo electrónico, Click Stream, Html, Social, Ubicación, Base de datos, Datos de sensor, Imágenes, Inteligencia procesable.
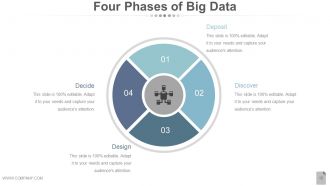
Diapositiva 15 : Esta diapositiva presenta las cuatro fases de Big Data. Los enumerados son: depositar, descubrir, diseñar, decidir.
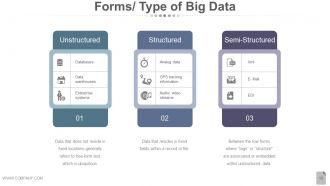
Diapositiva 16 : Esta diapositiva muestra Formas / Tipo de Big Data sin estructura: Los datos que no residen en ubicaciones fijas generalmente se refieren a texto de forma libre, que es ubicuo. Estructurado: datos que residen en campos fijos dentro de un registro o archivo. Semi-estructurado: Entre los formularios de remolque donde las “etiquetas” o la “estructura” están asociadas o incrustadas dentro de datos no estructurados.
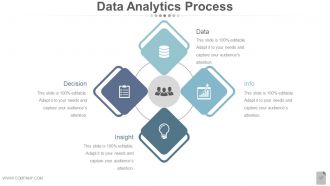
Diapositiva 17 : Esta diapositiva presenta el proceso de análisis de datos con los siguientes subtítulos: decisión, datos, conocimiento, información.
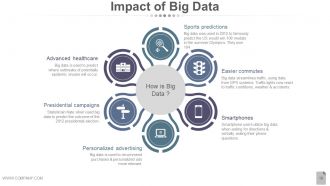
Diapositiva 18 : Esta diapositiva presenta el impacto de Big Data con los siguientes puntos: ¿Cómo es Big Data? Predicciones deportivas, Desplazamientos más fáciles, Smartphones, Publicidad personalizada, Campañas presidenciales, Asistencia sanitaria avanzada.
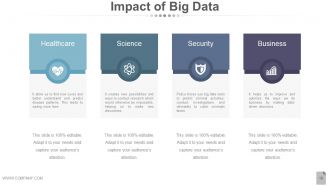
Diapositiva 19 : Esta diapositiva presenta el impacto de Big Data en los siguientes sectores: salud, ciencia, seguridad, negocios.
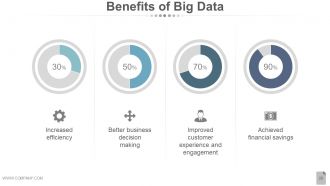
Diapositiva 20 : Esta diapositiva muestra los Beneficios de Big Data, como: Mejor toma de decisiones comerciales, Mejor experiencia y compromiso del cliente, Ahorro financiero logrado, Mayor eficiencia.
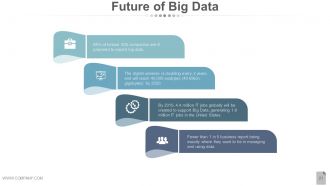
Diapositiva 21 : Esta diapositiva indica que se mostrará el futuro de los macrodatos.
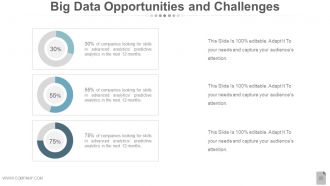
Diapositiva 22 : Esta diapositiva presenta las oportunidades y los desafíos de Big Data. Indíquelos aquí.
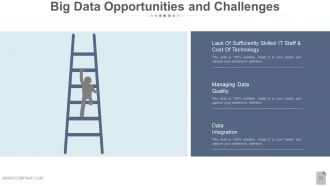
Diapositiva 23 : Esta diapositiva presenta Oportunidades y desafíos de Big Data, tales como: Falta de personal de TI suficientemente capacitado y costo de la tecnología, Gestión de la calidad de los datos, Integración de datos.
Diapositiva 24 : esta diapositiva se titula Diapositivas adicionales para avanzar. Puede cambiar / alterar el contenido de la diapositiva según sus necesidades.
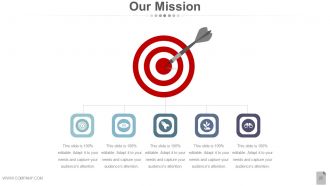
Diapositiva 25 : Esta es la diapositiva de Nuestra misión. Misión de la empresa estatal aquí.
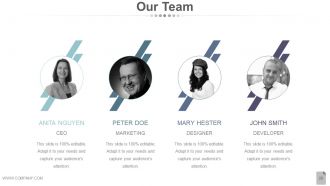
Diapositiva 26 : Esta es la diapositiva de Nuestro equipo con el nombre, la designación y los cuadros de imagen.
Diapositiva 27 : Esta es una diapositiva Acerca de nosotros. Indique aquí las especificaciones del equipo / empresa.
Diapositiva 28 : Esta diapositiva Nuestro objetivo. Indique los objetivos, etc. aquí.
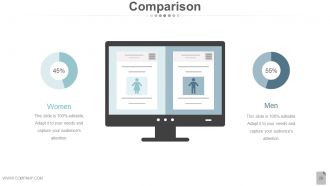
Diapositiva 29 : Esta es una diapositiva de comparación para comparar entidades / productos, etc. aquí.
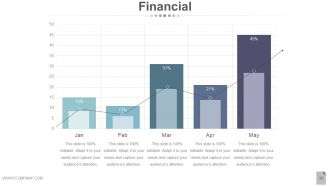
Diapositiva 30 : Esta es una diapositiva de puntuación financiera. Indique aquí los aspectos financieros, etc.
Diapositiva 31 : Esta es una diapositiva de Cotizaciones para transmitir mensajes de la empresa, creencias, etc. Puede cambiar el contenido de la diapositiva según sus necesidades.
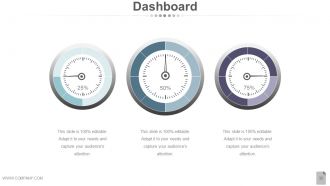
Diapositiva 32 : Esta es una diapositiva del Panel para indicar métricas, kpis, etc.
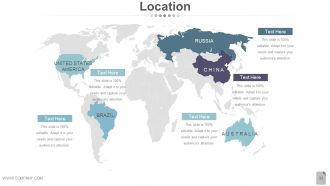
Diapositiva 33 : Esta es una diapositiva de ubicación de la imagen del mapa mundial para mostrar la presencia global, el crecimiento, etc.
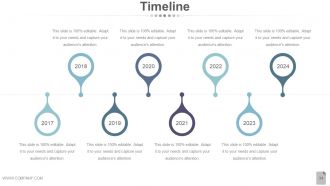
Diapositiva 34 : Esta es una diapositiva de la línea de tiempo para mostrar la evolución, el crecimiento, los hitos, etc.
Diapositiva 35 : Esta es una diapositiva Post It para marcar eventos, información importante, etc.
Diapositiva 36 : Esta es una diapositiva de periódico para mostrar noticias, eventos, etc. Puede cambiar el contenido de la diapositiva según sus necesidades.
Diapositiva 37 : esta es una diapositiva de imagen de rompecabezas para mostrar información, especificaciones, etc.
Diapositiva 38 : Esta es una diapositiva de imagen de destino. Indica los objetivos, etc. aquí.
Diapositiva 39 : Esta es una diapositiva de imagen circular para mostrar información, especificaciones, etc.
Diapositiva 40 : Esta es una diapositiva de imagen de diagrama de Venn para mostrar información, especificaciones, etc.
Diapositiva 41 : Esta es una diapositiva de imagen de mapa mental para mostrar información, especificaciones, etc.
Diapositiva 42 : Esta es una diapositiva de matriz para mostrar información, especificaciones, etc.
Diapositiva 43 : Esta es una diapositiva de imagen de Lego para mostrar información, especificaciones, etc.
Diapositiva 44 : Esta es una diapositiva de imagen de Siluetas para mostrar información, especificaciones, etc.
Diapositiva 45 : Esta es una diapositiva de imagen de jerarquía para mostrar información, especificaciones, etc.
Diapositiva 46 : Esta es una diapositiva de imagen de bombilla / idea para mostrar información, especificaciones, aspectos innovadores, etc.
Diapositiva 47 : Esta es una diapositiva con imagen de lupa para mostrar información, especificaciones, etc.
Diapositiva 48 : Esta es una diapositiva de imagen de gráfico de barras para mostrar la comparación de productos / entidades, información, etc.
Diapositiva 49 : Esta es una diapositiva de imagen de embudo para mostrar información, especificaciones, etc.
Diapositiva 50 : Esta es una diapositiva de agradecimiento con dirección # número de calle, ciudad, estado, números de contacto, dirección de correo electrónico.
Diapositivas de presentación de Powerpoint de Big Data Ppt con las 50 diapositivas:
Reduzca el volumen de revistas con nuestras diapositivas de presentación de Powerpoint de Big Data Ppt. Asegúrese de que el problema sea fácil de resolver.







FAQs for Big Data Ppt
So basically you've got your data ingestion stuff like Kafka, storage (Hadoop HDFS or whatever cloud thing you're using), and processing engines like Spark. Then there's the analytics and visualization layers on top. Honestly, security and data governance are super boring but you can't skip them - learned that the hard way. Orchestration tools like Airflow keep your pipelines from breaking constantly. My advice? Map out what data you actually need flowing where first. Don't try building everything at once or you'll go crazy. Pick components that make sense for your specific situation.
So basically you need automated pipelines checking for duplicates and missing data as it comes in. Data profiling tools are a must - there's no way you're manually checking Big Data volumes, that's just insane. Most companies track data lineage so they can figure out where stuff went wrong. Oh and schema validation is huge too, keeps everything standardized. The trick is baking quality checks right into your ingestion process instead of scrambling later. Honestly, start with monitoring dashboards first. Your team will thank you when they catch issues before they spiral.
Honestly, ML is like having a really smart intern who never gets tired. You feed it your data and it starts finding patterns you'd never catch manually - or would take you months to spot. It predicts what customers will do, catches fraud, suggests products, all that good stuff. The best part? It actually gets smarter over time without you babysitting it. I'd say pick one problem first and see how it performs. Don't try to boil the ocean right away. Trust me, once you see it work on something small, you'll be hooked on scaling it up.
Big Data lets you slice up customers way better than just looking at age and gender stuff. You're digging into purchase history, what they click on, social media habits - all that good data. Machine learning can find weird segments you'd never guess, like "people who shop Sunday mornings after scrolling Instagram for 20 minutes" (I swear these algorithms are getting creepy good). Mix your sales data with how people actually behave across your website, emails, whatever. Honestly? Start with your biggest money-makers first. Figure out what makes those customers tick, then build campaigns around that.
Honestly, data quality problems will drive you crazy - that's the big one. Storage costs add up fast too if you're not careful. Good luck finding engineers who actually get this stuff, they're expensive and hard to find. Your current systems probably can't handle the data volume anyway, so integration becomes this whole mess. Security and compliance requirements are brutal depending on your industry (banking is the worst). Performance issues always hit at 3am when everything's processing. Start with something small first, get your data governance sorted early, and seriously budget like double what you think for engineering talent. Trust me on that last part.
So data lakes are basically like throwing everything into one giant messy pile - videos, spreadsheets, random sensor stuff, you name it. No organization needed upfront. Warehouses? Total opposite. You've gotta clean and structure everything before it goes in, like a super organized filing system. Here's the thing though - lakes let you dump anything but they're slower when you actually want to find something specific. Warehouses are crazy fast for queries but way less flexible. Honestly depends what you're prioritizing - do you want the flexibility to store weird data types, or do you need lightning-fast searches?
Okay so basically three big things you gotta watch out for: privacy, consent, and bias. Get proper consent before grabbing anyone's personal data - be upfront about what you're doing with it. Privacy-wise, anonymize whatever you can and don't hoard unnecessary stuff. The bias thing is honestly where most people screw up, even experienced folks. Your models will just repeat whatever discrimination exists in your training data if it's not representative enough. Always check your datasets for fairness across different groups. Oh, and definitely do a privacy impact assessment on your current projects first - you'll catch problems early instead of dealing with disasters later.
So predictive analytics is like having a crystal ball for your business data. It digs through all your historical info to spot patterns and predict what's coming next. Pretty cool stuff, honestly. Instead of just reacting to things after they happen, you can actually see which customers might bail, when sales will jump, or if your equipment's about to crap out. The algorithms catch trends you'd never notice buried in all that data. My advice? Don't go crazy trying to predict everything at once. Pick one specific problem you're dealing with and test it out there first.
Honestly, Spark's probably your go-to for big data stuff - handles both batch and streaming pretty smoothly. Hadoop still works but feels kinda outdated now. If you don't want the headache of managing servers, just go with cloud options like AWS EMR or BigQuery. Way less painful. Python with pandas is solid for smaller datasets, though I guess that's obvious. Databricks is nice if you need that collaborative workspace thing. Oh, and definitely figure out what you actually need first - I've seen people overcomplicate this so much. Start simple, then scale up if needed.
Honestly, big data is pretty clutch for supply chains. You get real-time views of your inventory, demand patterns, supplier performance - all that stuff. The predictive side is where it gets really interesting though. Instead of scrambling when you run out of stock, you can see it coming weeks ahead. Same with demand spikes from weather changes or whatever's trending. Route optimization saves you tons on shipping too. Oh, and you'll spot quality issues way earlier by watching supplier data trends. My advice? Don't go crazy trying to fix everything at once. Pick one headache - maybe inventory forecasting - and nail that first.
Honestly, visualization is a game changer when you're drowning in data. Your brain processes visual patterns way faster than scanning through spreadsheets - like, we're just wired that way. Heat maps are perfect for geographic stuff, while time series charts show trends over time. The trick is matching the right chart type to what story you're trying to tell. I used to just stare at numbers until my eyes crossed, but now? A good graph shows me outliers and relationships instantly. Way less painful than scrolling through endless rows of data.
Honestly, big data changes everything about making decisions. Instead of just going with your gut, you're working with actual evidence. The pattern recognition stuff is crazy - you can predict trends and really get inside your customers' heads. Marketing campaigns become way more targeted, and you're not wasting resources on random guesses anymore. Though I gotta say, you need someone who can actually read all those numbers, or you'll just end up more confused than when you started. It's like having superpowers, but only if you know how to use them.
Honestly, the whole compliance thing is such a headache but here's what works. Build privacy stuff into your system from the start - way easier than retrofitting later. Map out what data you're actually collecting first because you can't protect mystery data. Set up governance frameworks to classify sensitive info and control who sees what. GDPR and CCPA keep changing the rules which is super annoying. Automate compliance checks when you can, train your team regularly, and definitely loop in legal early. Oh, and keep audit trails for everything - regulators love their paper trails.
AI analytics and real-time processing are totally worth watching - they're changing everything right now. Edge computing is huge too since it processes data way closer to the source, so everything runs faster. The automation stuff honestly gets me most excited because who wants to do manual work all day? Privacy tools and data democratization are trending hard, which is great for getting non-tech people actually using insights. Oh, and definitely audit what you've got first - see where these fit in. That's probably the smartest starting point anyway.
Honestly? Just grab Google Analytics and mess around with Apache Spark first - no need to blow your budget on fancy enterprise stuff. Collect data you'll actually use, not every single thing you can track. AWS and Google Cloud are great since you only pay for what you need. Most startups I know collect tons of data then never look at it again lol. If you can't afford a data scientist yet, try partnering with local universities or check out Kaggle for talent. The whole trick is proving this stuff works before you go crazy with expensive infrastructure. Start small, see results, then scale up.
-
Good
-
Nice
-
Excellent design and quick turnaround.
-
Topic best represented with attractive design.