

 0 Comment
 Customer Reviews

It is both more critical and more challenging than ever to answer the question, “What is happening at the call center?” That’s because today, no matter what business you run, your customer experience is your business. There is no doubt that it is your signature offering, your differentiator and your key revenue generator.
Consumers are more empowered than ever before. With access to an ever-growing number of digital touchpoints for connecting with peers, conducting research, and making buying decisions, today's businesses have to provide a level of service that is outstanding across the board. To execute customer service of the highest order, it’s your call center (across channels, this can be referred to as a contact center) that has to function as the heartbeat of the contact entire consumer-facing operation.
This puts call center performance under the metaphorical spotlight and microscope, as business leaders expect to have a clear, deep and near-real-time understanding of how call center performance helps (or hurts) their business. But as the simple call center has evolved into the modern, multi-channel contact center, it’s become increasingly difficult to gain a firm grasp on performance.
If you’re a call center service provider, checkout this proposal to pitch your services
The challenge isn’t just channel expansion. It’s multiple versions of multiple systems spread across multiple locations, unstructured data that’s unusable in its raw form and it’s correlating organization-wide data. In short, it’s the need to make sense of a trove of data that grows in size and complexity every day. Facing this challenge, one thing is becoming clear: Most contact centers need a better, smarter reporting solution. They need reporting that breaks down silos to give visibility across the contact center—and across the entire organization. They need Contact Center Reporting that is faster, more efficient and more accurate than manually managing endless “spreadmarts.” Finally, they need reporting that is more intuitive — A Call Center Performance Report with KPIs and data visualizations that everyone in the organization understands.
And Slideteam is here to provide you with just that! Presenting to you our Top 10 Call Center Report Template. These templates are 100% editable and content-ready; these provide you with a structure to build your consumers journey. With the desired flexibility to edit, they can be tailored as per your customer segmentation.
Let’s explore the templates!
Template 1: Call Center Report PPT Deck
This PPT Deck comprises 10 slides, showcasing details like KPI, statistics, performance evaluation template, etc. The dashboards provided in the template are comprehensive and ready-to-use, so you can deploy a detailed system on tracking right away! To simplify the comprehension and analysis of the gathered data, the PPT Deck has infographics like graphs, odometers, tables, etc. Continue reading to explore the features of the PPT Template.

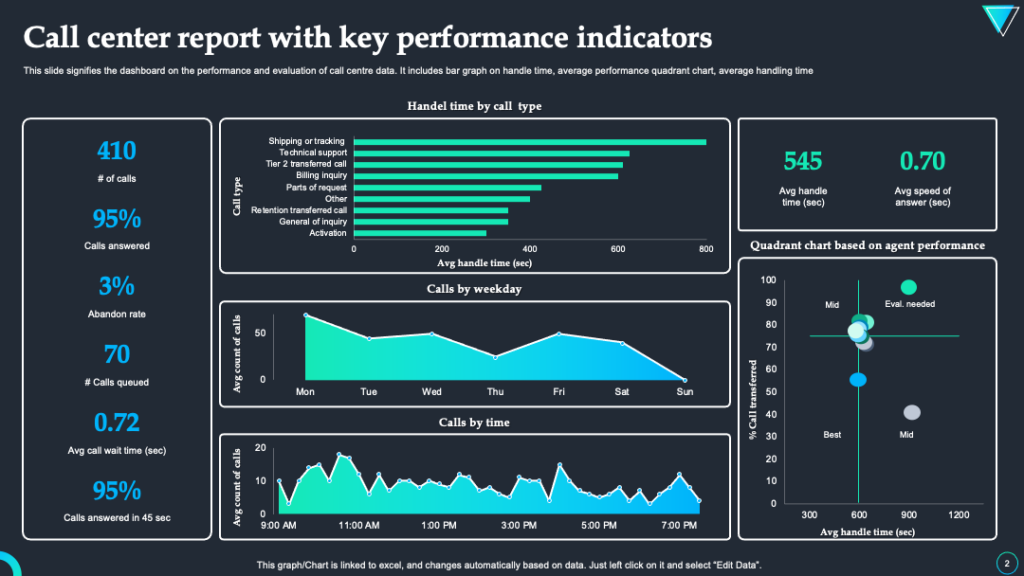
Template 2: Call Center Report with Key Performance Indicators PPT Template
This PPT Template includes essential KPIs to track and monitor the performance of customer care calling. It records the average call time based on types of call, for example, calls for tracking shipping, technical support, billing inquiries, general inquiries, etc. In this PPT Slide you can keep a count of the weekly calls as well as the number of calls received at defined times of the day. Based on this data, the slide features percentages and quadrant charts to highlight and interpret the findings. Download the Template Now!
Template 3: Call Center Report with Activity and Statistics PPT Template
Use this report template to keep a track of categories of calls. On the given odometers plot the total calls received, abandoned calls, and the answered calls. In case of group calls, you can segregate the percentage of incoming, outgoing, conference, transferred, and internal calls. Statistics like the abandonment rate, service level, average queue, average hold time, average speed answer, and average call duration are recorded on the bottom left column. You can also track the agents log in, log out time, availability. Download Now!

Template 4: Annual Performance Report of Call Center PPT Template
This PPT Slide will enable you to prepare a Performance Report on the call center for the year. The double bar graph depicts the ratio of answered calls to unanswered calls. This data will help you maintain a monthly record and recognise areas of concern. Write down key insights, like lack of training, implementation of CRM Software, and note the actions, tasks, and strategies to reduce the count of unanswered calls. Download Now!

Template 5: Call Center Report on Customer Executive Performance Evaluation PPT Template
Use this PPT Template to evaluate the performance of customer executives. The report keeps count of the total received calls, average call duration, call above SLA (service-level agreement), average CSAT (customer satisfaction) score, etc. The PPT Slide has infographics like line charts, bar graphs, pie charts, etc to read, visualize, and interpret data. Record the reasons and channels of consumer calls. Download Now!

Template 6: Call Center Report on Agents Monthly Performance PPT Template
Use this PPT Layout to sort and organize your user data. The table records the performance of each individual agent. You can tabulate the number of calls received by each agent, the average duration of calls, answered calls, unanswered calls, number of qualified calls, and the conversion rate. This data will help you provide specialized training to employees as per requirement. Download Now!

Template 7: Weekly Call Center Progress Report with KPIs PPT Template
This PPT Template includes essential KPIs to track and monitor performance of customer care call segments. The odometer can be used to track the success rate of calls and enquiries that individual agents resolve. In this PPT Slide, you can keep a count of the weekly calls as well as the number of calls received across predefined time slots. Based on this data, the slide features percentages, bar graphs, and charts to highlight and interpret the findings. Download the template now!

Template 8: Call Center Report on Customer Support Executive Performance PPT Template
Use this template to track and present the performance of each customer care agent. You can plot variables like number of calls received, answered calls, unanswered calls, resolved enquiries or total converted calls. Write down insights like the employee who had the highest conversion and the lowest conversion rate. Note any noticeable concerns, and list strategies to improve conversion rate by each agent at the call center. Download Now!

Template 9: Call Center Agent Activity Report PPT Template
Use this PPT Template to prepare a summative report on the performance agents in a call center. Compile the number of answered and unanswered calls by each agent. On the bottom left bar graph, plot the average and maximum talk time. On the circular chart provided, plot the types of enquiries best handled by each individual. Download Now!

Template 10: Call Center Report Icon with Customer Support PPT Template
This PPT Deck has additional slides for any information that you might have skipped in the previous slides. The template has an icon on the subject like call settings and call support. Use the bullet points to add text details. It can be used to note insights, strategies or action plans that must be implemented. Download Now!

Your Key to Client Engagement
Call Center Report Templates are your ticket to boosting client engagement and achieving success in the competitive arena. Tailored for impact, SlideTeam's Templates are simply the best for showcasing your call center solutions. They guarantee clarity, professionalism, and a visually appealing presentation that puts you ahead in the race for contracts. Download now to get started!