


Business Intelligence Solution Powerpoint Presentation Slides





Try Before you Buy Download Free Sample Product
 Impress Your
 Audience
 100%
100% Editable
 Save Hours
 of Time


A corporation or other organizations data warehousing is the safe electronic storing of information. The objective of data warehousing is to build a treasure mine of historical data that can be accessed and analyzed to offer helpful insight into the businesss operations. Here is a professionally designed template on Business Intelligence Solution that presents the companys current situation, gap analysis, the need for a data warehouse in the business, OLAP, OLTP, ETL, Schemas, MPP, etc. In this template, we have covered the features of data warehouse different architectures such as primary, three tier, etc. Moreover, in this DSS, we have included various types of data warehouses, cloud and modern data warehouses, components, general stages, etc. In addition, this PPT contains working of data warehouse, data warehouse design guidelines, approaches such as top-down and bottom-up, implementation of data warehouse, etc. Furthermore, this template includes comparing data warehouse with other storage systems such as database, operational database system, Data Lake, and data mart. Lastly, this deck comprises the impacts of data warehouse implementation on business, a 30-60-90 days plan, a roadmap to implement a data warehouse, and a dashboard. Get access now.
People who downloaded this PowerPoint presentation also viewed the following :
Content of this Powerpoint Presentation
Slide 1: This slide introduces Business Intelligence Solution. State your company name and begin.
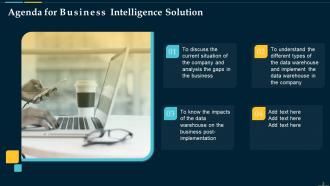
Slide 2: This slide states agenda of the presentation.
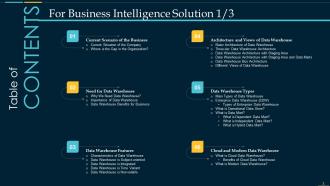
Slide 3: This slide shows Table of Content for the presentation.
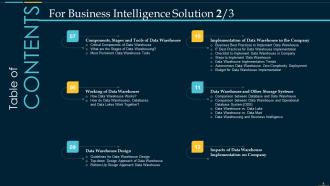
Slide 4: This is another slide continuing Table of Content for the presentation.
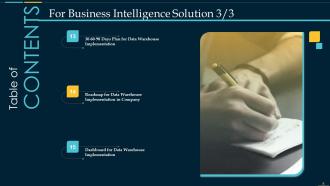
Slide 5: This is another slide continuing Table of Content for the presentation.
Slide 6: This slide highlights title for topics that are to be covered next in the template.
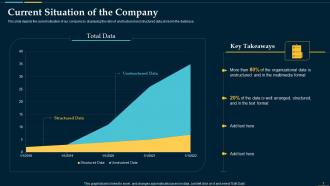
Slide 7: This slide depicts the current situation of our company by displaying the ratio of unstructured and structured data.
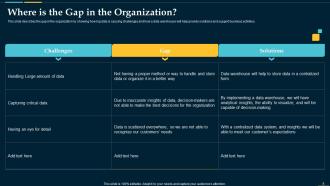
Slide 8: This slide presents gap in the organization by showing how big data is causing challenges.
Slide 9: This slide highlights title for topics that are to be covered next in the template.
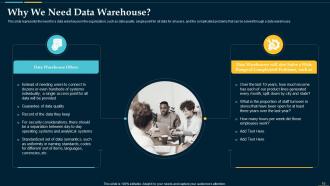
Slide 10: This slide displays need for a data warehouse in the organization, such as data quality, single point, etc.
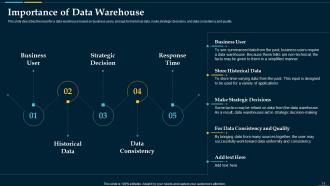
Slide 11: This slide shows need for a data warehouse based on business users, storage for historical data, etc.
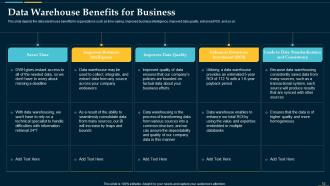
Slide 12: This slide depicts the data warehouse benefits for organizations such as time-saving, improved business intelligence, etc.
Slide 13: This slide highlights title for topics that are to be covered next in the template.
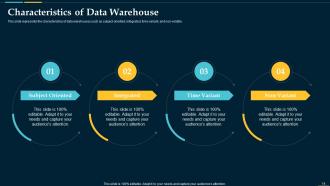
Slide 14: This slide shows characteristics of data warehouses such as subject-oriented, integrated, time-variant, and non-volatile.
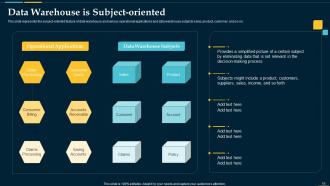
Slide 15: This slide represents the subject-oriented feature of data warehouse and various operational applications.
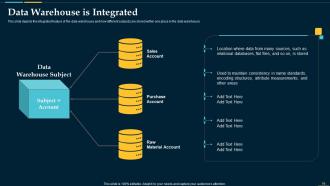
Slide 16: This slide depicts the integrated feature of the data warehouse and how different subjects are stored.
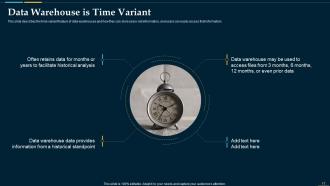
Slide 17: This slide shows time-variant feature of data warehouses and how they can store years-old information.
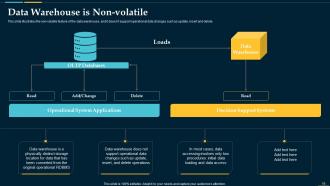
Slide 18: This slide illustrates the non-volatile feature of the data warehouse.
Slide 19: This slide highlights title for topics that are to be covered next in the template.
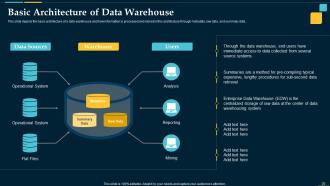
Slide 20: This slide displays the basic architecture of a data warehouse and how information is processed and stored in this architecture.
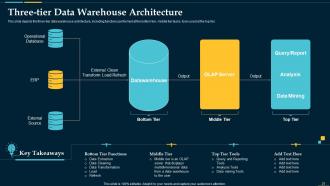
Slide 21: This slide depicts the three-tier data warehouse architecture, including functions performed.
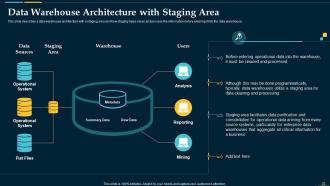
Slide 22: This slide describes a data warehouse architecture with a staging area.
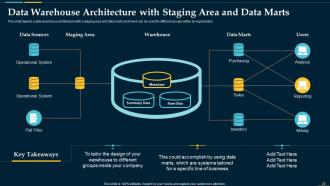
Slide 23: This slide presents a data warehouse architecture with a staging area and data marts.
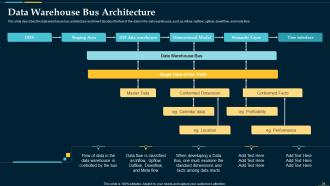
Slide 24: This slide shows data warehouse bus architecture and how it decides the flow of the data in the data warehouse.
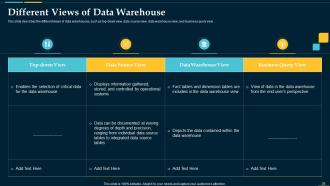
Slide 25: This slide displays different views of data warehouses, such as top-down view, data source view, data warehouse view, etc.
Slide 26: This slide highlights title for topics that are to be covered next in the template.
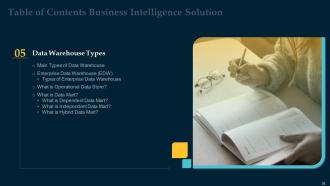
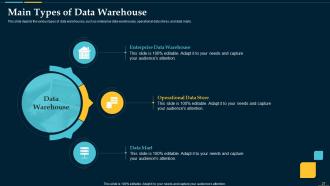
Slide 27: This slide depicts the various types of data warehouses, such as enterprise data warehouses, operational data stores, etc.
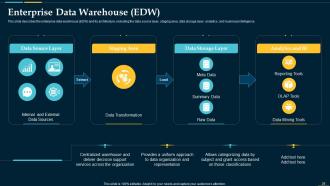
Slide 28: This slide presents the enterprise data warehouse (EDW) and its architecture, including the data source layer, staging area, etc.
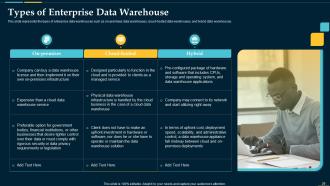
Slide 29: This slide represents the types of enterprise data warehouses such as on-premises data warehouses, cloud-hosted data warehouses, etc.
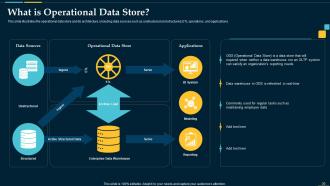
Slide 30: This slide illustrates the operational data store and its architecture, including data sources such as unstructured and structured.
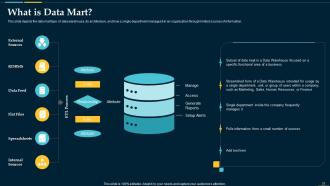
Slide 31: This slide depicts the data mart type of data warehouse, its architecture, and how a single department manages it.
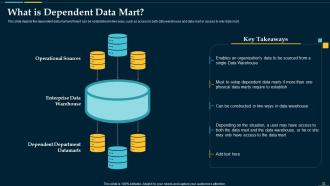
Slide 32: This slide depicts the dependent data mart and how it can be established in two ways.
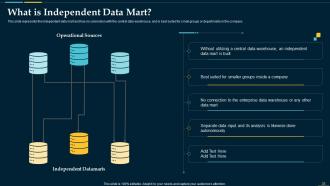
Slide 33: This slide presents the independent data mart and has no connection with the central data warehouse.
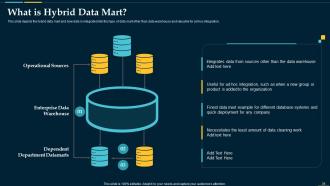
Slide 34: This slide depicts the hybrid data mart and how data is integrated into this type of data mart other than data warehouse.
Slide 35: This slide highlights title for topics that are to be covered next in the template.
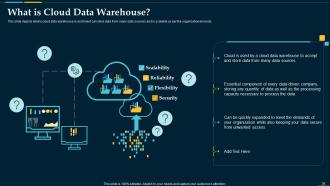
Slide 36: This slide depicts what a cloud data warehouse is and how it can store data from many data sources.
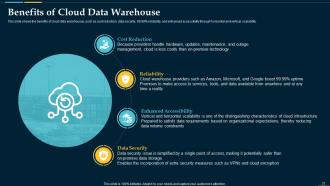
Slide 37: This slide shows the benefits of cloud data warehouses, such as cost reduction, data security, etc.
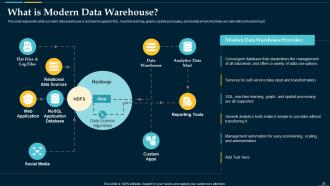
Slide 38: This slide represents what a modern data warehouse is and how it supports SQL, machine learning, etc.
Slide 39: This slide highlights title for topics that are to be covered next in the template.
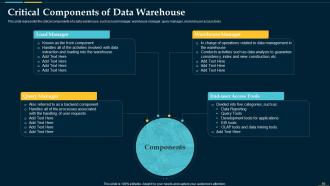
Slide 40: This slide displays the critical components of a data warehouse, such as load manager, warehouse manager, etc.
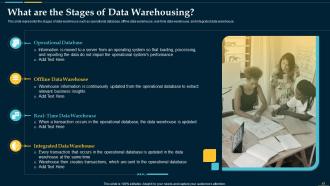
Slide 41: This slide represents the stages of data warehouse such as operational database, offline data warehouse, etc.
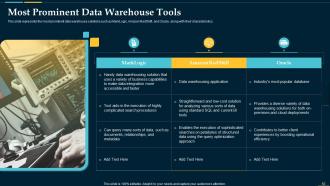
Slide 42: This slide represents the most prominent data warehouse solutions such as MarkLogic, Amazon RedShift, and Oracle.
Slide 43: This slide highlights title for topics that are to be covered next in the template.
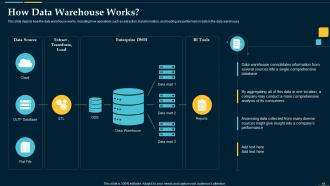
Slide 44: This slide depicts how the data warehouse works, including how operations such as extraction, transformation, etc.
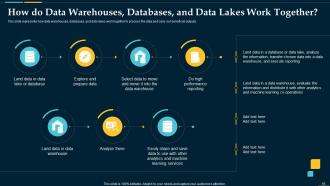
Slide 45: This slide represents how data warehouses, databases, and data lakes work together.
Slide 46: This slide highlights title for topics that are to be covered next in the template.
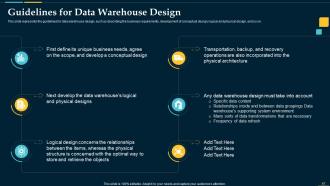
Slide 47: This slide represents the guidelines for data warehouse design, such as describing the business requirements, development of conceptual design, etc.
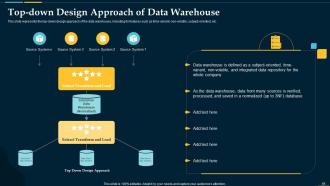
Slide 48: This slide presents the top-down design approach of the data warehouse, including its features such as time-variant, non-volatile, subject-oriented, etc.
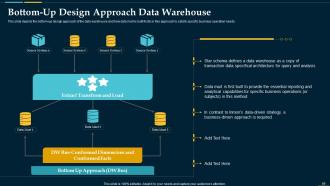
Slide 49: This slide depicts the bottom-up design approach of the data warehouse and how data mart is built firstly in this approach.
Slide 50: This slide highlights title for topics that are to be covered next in the template.
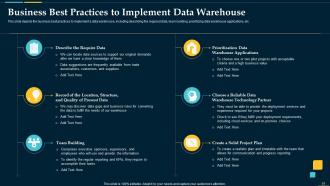
Slide 51: This slide depicts the business best practices to implement a data warehouse.
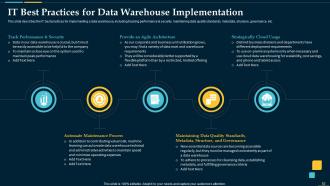
Slide 52: This slide describes the IT best practices for implementing a data warehouse, including tracking performance & security, maintaining data quality standards, etc.
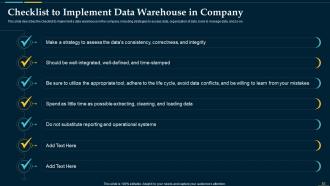
Slide 53: This slide shows Checklist to Implement Data Warehouse in Company.
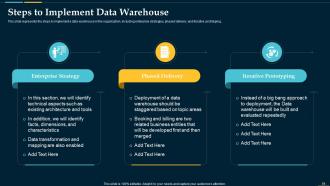
Slide 54: This slide represents the steps to implement a data warehouse in the organization, including enterprise strategies, phased delivery, etc.
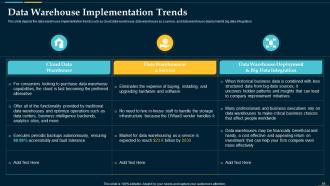
Slide 55: This slide depicts the data warehouse implementation trends such as cloud data warehouse, data warehouse as a service, etc.
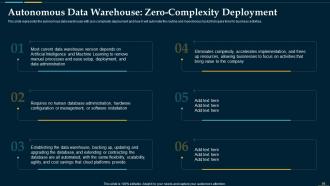
Slide 56: This slide represents the autonomous data warehouse with zero complexity deployment and how it will automate the routine.
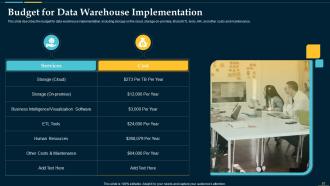
Slide 57: This slide describes the budget for data warehouse implementation, including storage on the cloud, storage on-premise, etc.
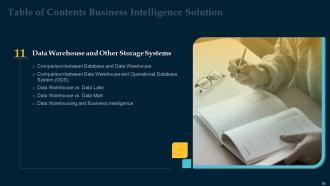
Slide 58: This slide highlights title for topics that are to be covered next in the template.
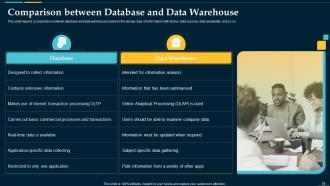
Slide 59: This slide depicts a comparison between database and data warehouse based on the design, type of information, etc.
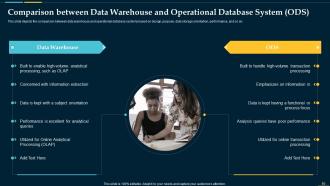
Slide 60: This slide displays the comparison between data warehouse and operational database systems based on design, purpose, etc.
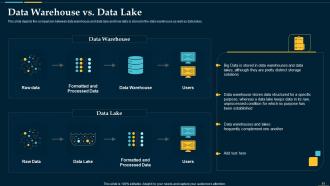
Slide 61: This slide depicts the comparison between data warehouse and data lake and how data is stored in the data warehouse.
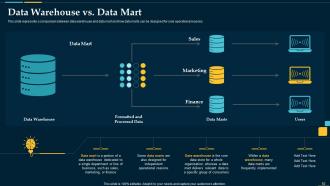
Slide 62: This slide represents a comparison between data warehouse and data mart and how data marts can be designed for sole operational reasons.
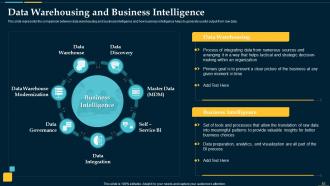
Slide 63: This slide presents the comparison between data warehousing and business intelligence and how business intelligence helps to generate useful output from raw data.
Slide 64: This slide highlights title for topics that are to be covered next in the template.
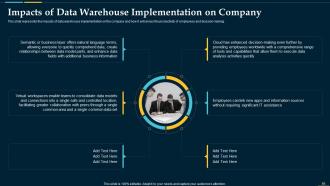
Slide 65: This slide represents the impacts of data warehouse implementation on the company.
Slide 66: This slide highlights title for topics that are to be covered next in the template.
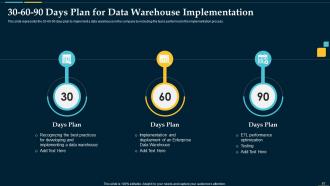
Slide 67: This slide represents the 30-60-90 days plan to implement a data warehouse in the company.
Slide 68: This slide highlights title for topics that are to be covered next in the template.
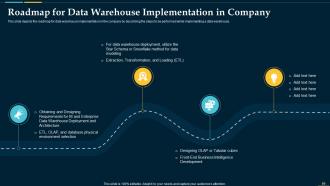
Slide 69: This slide depicts the roadmap for data warehouse implementation in the company.
Slide 70: This slide highlights title for topics that are to be covered next in the template.
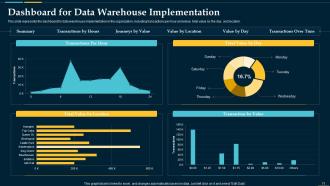
Slide 71: This slide shows dashboard for data warehouse implementation in the organization.
Slide 72: This slide is titled as Additional Slides for moving forward.
Slide 73: This slide highlights title for topics that are to be covered next in the template.
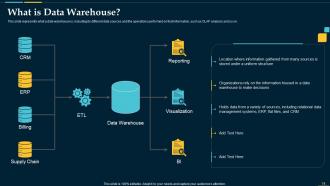
Slide 74: This slide represents what a data warehouse is, including its different data sources and the operations performed.
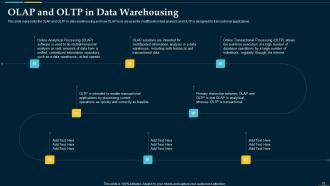
Slide 75: This slide displays the OLAP and OLTP in data warehousing and how OLAP tools are used for multifaceted data analysis.
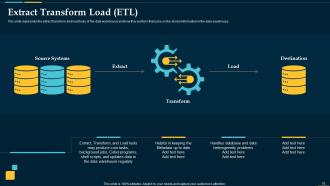
Slide 76: This slide represents the extract transform and load tools of the data warehouse and how they perform their jobs.
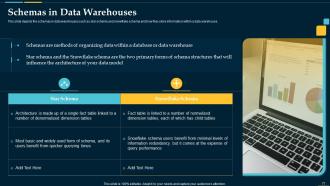
Slide 77: This slide depicts the schemas in data warehouses such as star schema and snowflake schema.
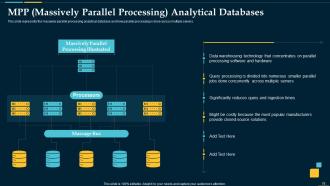
Slide 78: This slide represents the massively parallel processing analytical database and how parallel processing is done.
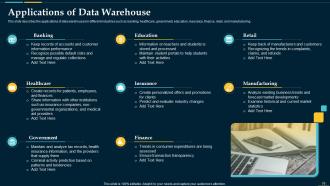
Slide 79: This slide describes the applications of data warehouses in different industries such as banking, healthcare, government, etc.
Slide 80: This slide contains all the icons used in this presentation.
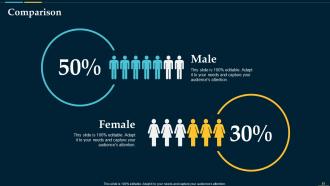
Slide 81: This is a Comparison slide to state comparison between commodities, entities etc.
Slide 82: This is About Us slide to show company specifications etc.
Slide 83: This slide presents Post It Notes. Post your important notes here.
Slide 84: This slide shows Circular Diagram with additional textboxes.
Slide 85: This slide displays Puzzle with related icons and text.
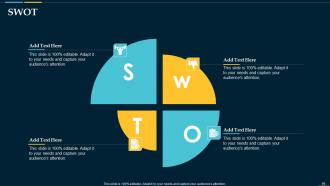
Slide 86: This slide shows SWOT describing- Strength, Weakness, Opportunity, and Threat.
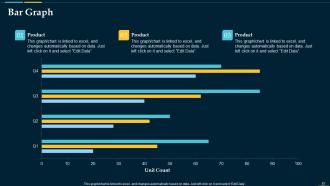
Slide 87: This slide shows Bar Graph with three products comparison.
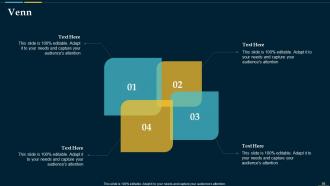
Slide 88: This slide presents Venn diagram with text boxes.
Slide 89: This is a Thank You slide with address, contact numbers and email address.
Business Intelligence Solution Powerpoint Presentation Slides with all 94 slides:
Use our Business Intelligence Solution Powerpoint Presentation Slides to effectively help you save your valuable time. They are readymade to fit into any presentation structure.











FAQs for Business Intelligence Solution
Look, you need four things to actually pull this off. Clean data that doesn't suck - if your sources are garbage, everything else is pointless. Get tools that match what your team can handle (I've seen so many companies blow money on software they never figure out). You'll also need people who can read the data AND explain what it means to everyone else. Oh, and probably most important - actual processes so insights don't just sit there looking pretty while nobody acts on them. Honestly, half the BI dashboards I see are basically expensive wallpaper. Start by checking what data you've got and figure out where decisions are currently a total mess.
Track both hard numbers and the squishier stuff to see if your BI projects actually work. Decision-making speed, data adoption across teams, whether people use those dashboards beyond the first login (honestly, most forget they exist). Measure ROI through cost savings or revenue bumps that came directly from better insights. Set your baselines before launching anything - otherwise you're just guessing later. Pick 3-5 KPIs that actually matter to your company and stick with tracking them consistently. The measurement part is boring but it's literally the only way to know if you're succeeding.
Honestly, data viz is a game changer for making sense of all those numbers. Raw spreadsheets are basically useless when you're trying to find actual insights. Charts and graphs let you see patterns right away - trends jump out, weird outliers become obvious. Your stakeholders can actually understand what's happening without drowning in data. Plus you'll spot opportunities way faster than scrolling through Excel hell. The trick is picking the right chart type though. Bar charts work great for comparisons, but don't throw everything into a pie chart just because it looks neat.
Honestly, big data has completely changed the BI game. You're not stuck with just traditional databases anymore - now you can pull from social media, IoT sensors, clickstreams, whatever. The best part? Real-time insights instead of waiting around for those monthly reports that nobody wanted to wait for anyway. Your analytics can actually predict stuff now rather than just telling you what already happened. My advice would be to figure out which unstructured data sources will actually help your decisions. Don't just hoard data because you can - that gets messy fast.
Honestly, your data's gonna be way messier than you expect - duplicates everywhere, missing chunks, formats that make zero sense. That's the real time killer. Plus good luck getting people to ditch their beloved Excel spreadsheets, because apparently Susan from accounting has been doing it "just fine" for 15 years. Budget more time and money than you think too. Oh, and picking the right tools is surprisingly tricky when there's like a million options out there. Start with something small first though - test it out before you go all in. Get that data cleaned up early or you'll hate yourself later.
So most BI platforms already have AI baked in - Tableau, Power BI, Qlik, all that stuff. Pretty wild how much it's evolved tbh. The AI can spot patterns automatically and let people ask questions in regular English instead of writing those annoying SQL queries. Machine learning does the heavy lifting for predictions too. Start with one clean dataset though - don't go crazy trying to do everything at once. Pick something specific where you think AI might actually help. Oh, and make sure your data isn't a mess first, otherwise you'll just get garbage results.
Honestly, start with validation rules at the source - that's where most people mess up. Catch errors before they hit your BI system with format checks, range validation, duplicate detection, all that stuff. I've watched so many good dashboards get completely wrecked by bad data! Set up automated monitoring too, with alerts when quality drops. Oh and make sure someone actually owns data quality for each system - can't tell you how often that gets overlooked. Document your standards clearly. Focus on your most critical data flows first, then expand from there.
Dude, the live dashboards are game-changers - they update automatically so you catch problems right when they start. You'll get alerts when your important metrics go crazy, which honestly saves so much stress. What I love most is clicking around the charts to dig into issues myself instead of bugging IT for reports every time. Your team can check everything on their phones too, which is clutch. Oh, and definitely set up those key alerts first - that's where you'll notice the biggest difference in how fast you can react to stuff.
Dude, BI tools are actually pretty cheap now - Power BI or Tableau Public won't break the bank. Start small, maybe customer data or sales stuff. Here's the thing though - you guys can move way faster than big companies who need like 6 meetings to change a lightbulb. Spot a trend? You can pivot immediately while they're still forming committees. Pick one thing first (I'd probably do customer segmentation but whatever makes sense for your business), see what happens, then expand. The whole "being nimble" thing actually works in your favor here.
Honestly, I'd go with cloud BI unless you've got some crazy compliance stuff going on. Way faster to get running - we're talking weeks vs months of setup hell. Your team can pull up dashboards from wherever, and scaling happens without dropping cash on new servers. The maintenance headaches? Not your problem anymore since the vendor deals with updates and all that fun stuff. Yeah, on-premises gives you more control over security and tweaking things exactly how you want, but most cloud providers aren't messing around with security these days. Speed's the real winner here though.
So retailers are all about tracking what customers buy and when - helps them figure out pricing and what to stock. Manufacturing companies focus more on supply chain stuff and predicting when machines might break down. Healthcare is wild though, they're juggling patient outcomes AND costs at the same time. Banks go hard on fraud detection and risk analysis, which makes sense. Telecom companies? They're trying to stop people from switching providers and keep their networks running smooth. Honestly, you gotta figure out what's actually breaking in your industry first, then worry about which tools to use.
Okay so first thing - don't collect people's personal stuff without asking. That's just basic decency. Be upfront about what data you're using too, because nobody likes feeling spied on at work. Your algorithms will probably have some bias baked in (they always do), so watch out for that screwing over employees or customers unfairly. Honestly, I'd just ask myself "would I be cool if this was all public?" Trust me, if you can't answer yes to that, you're probably doing something sketchy. The whole surveillance thing gets weird fast if you're not careful about boundaries.
Dude, BI totally changes how you use your CRM. Instead of just storing contacts, you'll actually see what customers are doing. Like, you can catch who's about to bail, figure out what makes people buy again, and find your most profitable segments. The visualizations are pretty cool once you get into it. Track lifetime value, predict trends, personalize campaigns - all based on real data instead of guessing. Honestly beats flying blind. Just connect your CRM to a BI tool and throw together some basic dashboards to start.
Honestly, AI analytics are everywhere right now - tools that just find patterns for you without all the manual digging. Real-time processing is big too. Also seeing tons of self-service platforms where anyone can build dashboards, not just the data team (which is honestly about time). You can literally type questions in normal English and get charts back now. Pretty wild how good that's gotten. Cloud platforms are dominating since scaling doesn't suck anymore. If you're buying anything, go for tools that do multiple things rather than buying five different point solutions. Way less headache.
So predictive analytics shifts your BI from showing what already happened to forecasting what's coming next. Pretty cool stuff, honestly. You can spot customer churn before it happens, figure out inventory needs ahead of time, see which leads will actually convert. Way better than just staring at last quarter's numbers all day. Think of it as giving your data some fortune-telling powers - though don't expect it to be right 100% of the time! My advice? Pick one thing that actually matters to your team first. Test it out. Then you can go crazy with other use cases once you've got the hang of it.
-
I’ve been your client for a few years now. Couldn’t be more than happy after using your templates. Thank you!
-
Thank you for offering such helpful pre-designed templates. They are really beneficial to me in my job.