

Cash cow in bcg matrix displaying dog star question and cow




Try Before you Buy Download Free Sample Product
 Impress Your
 Audience
 100%
100% Editable
 Save Hours
 of Time


You will invariably excel with our Cash Cow In Bcg Matrix Displaying Dog Star Question And Cow. Consistency is an inbuilt characteristic.
People who downloaded this PowerPoint presentation also viewed the following :
Content of this Powerpoint Presentation
Knowing what activities, products, or services work for you and which are just resource guzzlers without adequate returns is not business. Making sense of the product portfolio and organizing it into segments is critical.
The BCG Matrix is a well-known management method that teaches you the segments each of your product portfolio categories or groups comprises. Businesses find it valuable to use this matrix, but they need a way to spread the message to many stakeholders at once. For this reason, PPT presentations have always been the go-to medium, and SlideTeam offers you this content-ready template to ensure you do it in the most professional way possible.
Find the best-in-class BCG Matrix slide here.
The templates are 100% editable and customizable, offering you the structure and a starting point. The slide is also technically correct and clutter-free ensuring you always have the edge in communicating to the audience.
Let’s explore.
Template 1 Cash Cow in BCG Matrix PPT Template

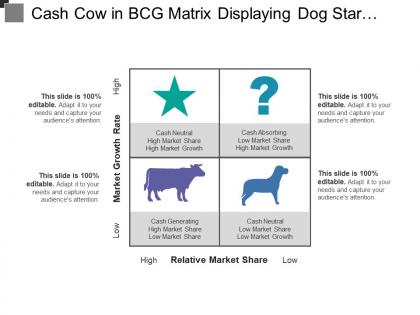
This top-notch PowerPoint Template is meant to give product managers and other CEOs an idea about their products’ relative performance. The slide compares relative market share and market growth gate to give managers an accurate description of where their products lie on this matrix. The market growth rate is on the X-axis, and the relative market share is on the Y-axis. It is a content-ready PowerPoint Slide showcasing how products can be represented as Stars, Question Marks, Cows, and Dogs.
This comparison is based on the actual names and the performance of the product or the set of products. Stars have a high market share, meaning there is no alternative, and in a high market growth zone (there will still be demand for the product as the overall market grows). Use the PPT Template to understand how these are cash-neutral, as capturing the market takes up excess money that is generated due to the high relative market share. Cows are like products that can be milked, as these are cash-generating due to the high market growth rate, but a low market share means they can sustain only for a period. Similarly, the template depicts the other two product categories of question marks and dogs with graphs. To understand this well, download the template.
*******
GET CLARITY ON PRODUCT PORTFOLIO
When making multiple products or even services, it’s advisable to use the BCG Matrix to ensure that management is clear on where to focus. The BCG Matrix is a valuable tool, as it works on data and the way things stand. There are no tall promises or fancy analyses, just a plain re-look at the facts and then a picture and representation of each product. Use the BCG Matrix, as explained in our slide, now!
PS Get this exclusive SlideTeam product, which is a BCG Matrix Model for market entry analysis.
Cash cow in bcg matrix displaying dog star question and cow with all 5 slides:
Build a connect with our Cash Cow In Bcg Matrix Displaying Dog Star Question And Cow. They will be good conduits for your thoughts.



FAQs for Cash cow in bcg matrix displaying dog star
So the BCG Matrix breaks things into four boxes - Stars are your high growth, high market share winners that need cash pumped into them. Cash Cows? Low growth but they dominate their market, so they're basically funding everything else. Question Marks are honestly a pain - high growth potential but weak market position, so you're gambling on whether to invest or bail. Dogs sit in the worst spot with low growth AND low share. Most companies ditch these unless there's some weird strategic reason not to. Basically you plot all your products on this grid to see what's making money vs. what's eating it.
So basically you plot products on two axes - market share vs your biggest competitor, and how fast the market's growing. Stars are high share/high growth, Cash Cows are high share but slow growth, Question Marks are low share but growing fast, and Dogs are just... sad (low everything). Most people use 10% as the growth cutoff, but honestly that feels pretty arbitrary depending on your industry. The whole point is figuring out where to throw money, where to coast and collect profits, and what to maybe just dump. Once you map it out, the strategy decisions get way clearer.
Look at your industry's revenue growth over the last 2-3 years plus whatever forecasts you can find. Most people use 10% as the split between high/low growth, though that number always seemed kinda random to me. Relative market share is your share divided by your biggest competitor's - above 1.0 means you're winning. Define your market tight enough to actually mean something but not so narrow you're ignoring real competitors. Oh and stay consistent across all your products or you can't compare them properly on the matrix. That's where people usually mess up.
Okay so the BCG Matrix is basically your game plan for resource allocation. Stars get the most cash since they're crushing it in growing markets. Cash Cows? Milk them dry - they're your reliable money makers that fund everything else. Dogs get starved unless there's some miracle comeback potential (which let's be honest, rarely happens). Question Marks are where it gets interesting though. You either go all-in to turn them into Stars or just cut your losses. The whole point is that each business unit needs a completely different strategy based on where they sit, not just how much profit they're making right now.
So BCG Matrix is way more narrow than SWOT or GE/McKinsey - it just focuses on market growth vs your market share. SWOT covers all that internal/external stuff, and GE/McKinsey weighs tons of different factors. BCG feels almost too basic at first, but that's honestly what makes it useful. You get four simple buckets: stars, cash cows, question marks, dogs. Makes it super clear where to put your money. I mean, my old boss loved this thing because you could literally point at a quadrant and say "invest here, kill that." Perfect when you need quick decisions about your product mix without overthinking it.
Question Marks are honestly a pain - you've got two real options here. Either dump serious money into building market share, or just bail completely. These products burn through cash because they're in growing markets but you don't own much of them yet. Here's the thing though: half-assing it is the worst move possible. You need to decide if you can actually win and turn it into a Star, or if you're just bleeding money for no reason. Go big or go home basically - put real resources behind it or redirect that cash to your Cash Cows instead.
Yeah, BCG Matrix totally works for service businesses! You're just looking at service lines instead of physical products. Market share and growth rates still count whether you're doing consulting or running a salon. The annoying part is figuring out what counts as a "business unit" - like, is it your whole IT practice or just the cybersecurity piece? But once you sort that out, the star/cash cow/dog thing works great. Honestly might be easier with services since you can track client relationships and recurring revenue better than random product sales. I'd start by just listing out your main service offerings first.
Before you make any moves, map out both portfolios using the BCG Matrix - plot each business unit by market share and growth rate. Stars and Cash Cows are no-brainers, but honestly, Question Marks might surprise you if your company can unlock their potential. Dogs though? Usually just dead weight. This whole exercise shows you what redundancies exist and which units you'd want to dump later. Plus you'll see gaps in the combined portfolio. The key is running this analysis super early in due diligence - that way you can bake the portfolio reshuffling costs right into your valuation instead of getting hit with surprises later.
Honestly, the BCG Matrix is pretty limited when you think about it. Yeah, it puts companies into neat little boxes, but real businesses are way messier than that. Plus it assumes big market share = big profits, which... not always? Competition and market changes can totally flip that logic. I'd definitely pair it with other tools like Porter's Five Forces or SWOT analysis - gives you a fuller picture. Don't make major decisions based on BCG alone though. It's useful but not the whole story, you know?
Honestly, I'd check it once a year minimum, but quarterly makes way more sense if you're in something fast-paced like tech. Market share and growth can flip so quickly - especially when new competitors just appear out of nowhere. Set up those calendar reminders, but also be ready to pull it out whenever something major hits your industry. Actually, don't just update the thing and then shove it in a drawer somewhere. Use what you learn to move money around and tweak your strategy. The whole point is making better decisions, right?
Yeah, you definitely need good market research for the BCG Matrix to actually work. Without solid data on market growth and your competitors' market share, you're just throwing darts blindfolded. I've watched teams completely botch this - putting products in the wrong quadrants because they went with their gut instead of numbers. Growth projections are huge here, plus you need reliable competitor performance data. Market size trends too, obviously. Start with whatever research you've got already, then figure out what's missing. The whole thing falls apart if your data's sketchy, honestly.
Yeah, the BCG Matrix totally works for small businesses - you just gotta keep it simple. Take your 3-5 main products and sort them into those four boxes. Stars get your cash and attention since they're growing fast. Cash Cows? Milk them for steady money but don't overthink it. Here's the thing though - most small biz owners try to chase every Question Mark opportunity, which is honestly a mistake. Pick ONE to bet on. Dogs are dead weight, so cut them loose even if it feels weird. I did this last quarter and it clarified everything about where to spend my time.
Oh totally - trends can flip your whole BCG setup crazy fast. AI just made tons of traditional software companies go from stable cash cows to "wait, what now?" question marks basically overnight. Same thing happened with electric cars - they went from total dogs to rising stars once everyone got obsessed with sustainability. Market share and growth rates? They shift constantly based on what people want, new tech, regulations, whatever. That's honestly what makes the BCG matrix actually useful for planning stuff out. I'd check your positioning every few months, especially if you're in tech or anything that moves quickly. Watch for those early warning signs.
So Apple's the classic example here - they spotted the iPhone as their rising star and poured money into it while milking the iPod as a cash cow until it died out. GE did something similar, basically gutting their whole portfolio to dump the "dog" businesses and focus on the good stuff. Coca-Cola's smart about it too - they treat regular Coke as their money maker while testing weird new flavors (some are honestly terrible). The thing is, you can't just do this analysis once and call it done. Companies that actually succeed with this revisit it constantly because products don't stay in the same category forever.
So basically, new products start as Question Marks - you're in a hot market but don't have much share yet. If things go well, you'll become a Star with high growth AND high share. But here's the thing - markets always cool down eventually. Your Stars turn into Cash Cows when growth slows but you still dominate. Then there's the sad ending: Dogs happen when both your share and market growth tank. I mean, it's pretty predictable once you think about it. Just track where your product sits in its lifecycle and you can plan your investments way better.
-
Perfect template with attractive color combination.
-
Excellent work done on template design and graphics.