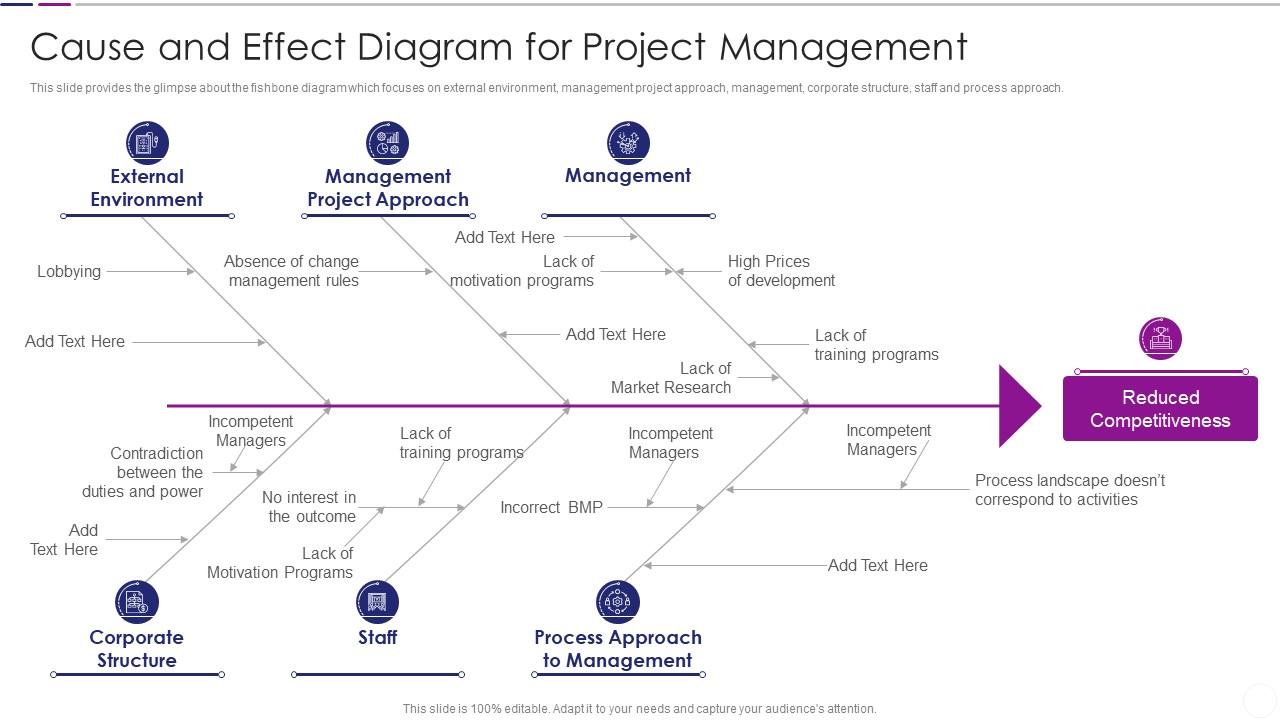
Cause And Effect Diagram For Project Management Quantitative Risk Analysis
This slide provides the glimpse about the fishbone diagram which focuses on external environment, management project approach, management, corporate structure, staff and process approach.
- Google Slides is a new FREE Presentation software from Google.
- All our content is 100% compatible with Google Slides.
- Just download our designs, and upload them to Google Slides and they will work automatically.
- Amaze your audience with SlideTeam and Google Slides.
-
Want Changes to This PPT Slide? Check out our Presentation Design Services
- WideScreen Aspect ratio is becoming a very popular format. When you download this product, the downloaded ZIP will contain this product in both standard and widescreen format.
-

- Some older products that we have may only be in standard format, but they can easily be converted to widescreen.
- To do this, please open the SlideTeam product in Powerpoint, and go to
- Design ( On the top bar) -> Page Setup -> and select "On-screen Show (16:9)” in the drop down for "Slides Sized for".
- The slide or theme will change to widescreen, and all graphics will adjust automatically. You can similarly convert our content to any other desired screen aspect ratio.
Compatible With Google Slides

Get This In WideScreen
You must be logged in to download this presentation.
PowerPoint presentation slides
This slide provides the glimpse about the fishbone diagram which focuses on external environment, management project approach, management, corporate structure, staff and process approach. Deliver an outstanding presentation on the topic using this Cause And Effect Diagram For Project Management Quantitative Risk Analysis. Dispense information and present a thorough explanation of External Environment, Management Project Approach, Corporate Structure, Process Approach using the slides given. This template can be altered and personalized to fit your needs. It is also available for immediate download. So grab it now.
People who downloaded this PowerPoint presentation also viewed the following :
Cause And Effect Diagram For Project Management Quantitative Risk Analysis with all 6 slides:
Use our Cause And Effect Diagram For Project Management Quantitative Risk Analysis to effectively help you save your valuable time. They are readymade to fit into any presentation structure.
-
SlideTeam makes creating presentations easy. Unlimited products, premium quality designs and affordable.
-
Placing an order on SlideTeam is very simple and convenient, saves you a lot of your time.


