


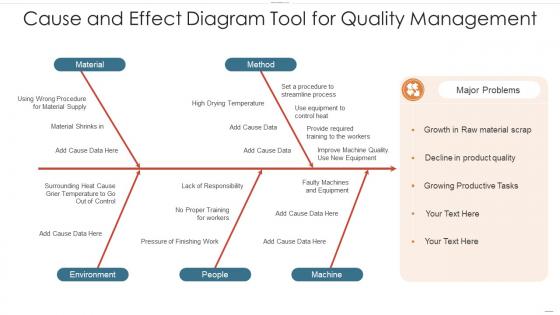
Cause and effect diagram tool for quality management




Try Before you Buy Download Free Sample Product
 Impress Your
 Audience
 100%
100% Editable
 Save Hours
 of Time


Our Cause And Effect Diagram Tool For Quality Management are topically designed to provide an attractive backdrop to any subject. Use them to look like a presentation pro.
People who downloaded this PowerPoint presentation also viewed the following :
Cause and effect diagram tool for quality management with all 2 slides:
Use our Cause And Effect Diagram Tool For Quality Management to effectively help you save your valuable time. They are readymade to fit into any presentation structure.
FAQs for Cause and effect diagram tool
A cause and effect diagram is a visual tool that systematically maps potential causes contributing to a specific problem or effect, organizing them into categories like people, processes, equipment, and environment. Manufacturing teams, healthcare organizations, and service industries use these diagrams to identify root causes, streamline troubleshooting processes, and enhance problem-solving efficiency, ultimately delivering faster resolutions and improved operational performance.
The main components of a cause and effect diagram include the problem statement (fishbone head), major cause categories (primary bones), subcauses (secondary bones), and root causes (detailed branches). These elements work together by systematically organizing potential factors, enabling teams to trace problems from symptoms to sources, and facilitating comprehensive analysis that helps organizations identify actionable solutions.
A cause and effect diagram helps identify root causes by systematically mapping all potential contributing factors across categories like people, processes, materials, and environment, preventing teams from overlooking critical elements. This structured approach enables organizations to move beyond surface-level symptoms, with many finding that comprehensive root cause analysis ultimately delivers more effective solutions and prevents recurring issues.
Cause and effect diagrams are most commonly utilized in manufacturing, healthcare, automotive, aerospace, and quality management sectors. These industries leverage fishbone diagrams to systematically identify root causes of defects, patient safety issues, production failures, and process inefficiencies, ultimately enabling faster problem resolution, reduced costs, and enhanced operational efficiency across complex systems.
A cause and effect diagram identifies root causes of problems through branching categories like methods, materials, and manpower, while a flowchart maps sequential process steps and decision points. These tools serve complementary purposes, with cause and effect diagrams helping teams analyze why issues occur, and flowcharts documenting how processes unfold, ultimately enabling organizations to both troubleshoot problems and optimize workflows.
Common pitfalls include rushing the brainstorming process, focusing only on obvious causes, failing to involve diverse team perspectives, creating overly complex diagrams, and stopping at surface-level analysis. These mistakes ultimately limit problem-solving effectiveness, with many organizations finding that structured facilitation, cross-functional input, and systematic cause exploration deliver more actionable insights and sustainable solutions.
Team collaboration enhances cause and effect diagrams by bringing diverse perspectives, specialized expertise, and comprehensive problem analysis from multiple stakeholders. Through collaborative brainstorming sessions, teams identify root causes more thoroughly, validate findings across departments, and ensure implementation feasibility, with many organizations finding that cross-functional input delivers more accurate solutions and stronger buy-in.
Brainstorming techniques for cause and effect diagrams include the 5 Whys method, fishbone analysis, mind mapping, affinity diagramming, and cross-functional team sessions. These approaches enhance problem-solving by encouraging diverse perspectives, systematic cause identification, and comprehensive root cause analysis, with many organizations finding that structured brainstorming delivers faster resolution and improved operational efficiency.
Qualitative data provides contextual insights through team brainstorming, expert opinions, and observational feedback to identify potential causes, while quantitative data validates these causes through statistical analysis, measurement frequencies, and performance metrics. Organizations combine both approaches by using qualitative input during initial diagram creation and quantitative validation through data analysis, ultimately delivering more accurate root cause identification and evidence-based problem-solving strategies.
Stakeholders provide essential domain expertise, diverse perspectives, and operational insights when developing cause and effect diagrams, ensuring comprehensive problem analysis across departments and functions. Their collaborative input helps identify root causes that might be overlooked by individual analysts, while fostering organizational buy-in and ownership of solutions, ultimately enhancing implementation success rates.
Cause and effect diagrams adapt to remote teams through digital collaboration platforms like Miro, Lucidchart, and Microsoft Whiteboard, enabling real-time brainstorming, screen sharing, and asynchronous input collection. Virtual teams leverage breakout rooms for focused analysis, recorded sessions for documentation, and cloud-based templates for consistent formatting, ultimately delivering the same systematic problem-solving benefits while enhancing accessibility and participation across distributed organizations.
**INPUT**: What are some tips for visually organizing a cause and effect diagram for better clarity? **OUTPUT**: Effective visual organization includes using consistent spacing between main branches, color-coding different cause categories, limiting sub-causes to maintain readability, and ensuring clear labeling throughout. These design principles streamline problem analysis by reducing visual clutter, enhancing team comprehension, and facilitating faster root cause identification, with many organizations finding that well-structured diagrams ultimately deliver more focused solutions and improved collaborative decision-making.
Cause and effect diagrams facilitate continuous improvement by systematically identifying root causes, enabling data-driven decision making, and creating structured problem-solving frameworks that teams can repeatedly use. These visual tools streamline analysis processes, enhance cross-functional collaboration, and deliver measurable improvements in quality control, with many manufacturing and service organizations finding sustained operational efficiency gains.
Professional cause and effect diagram software includes Lucidchart, Microsoft Visio, SmartDraw, Creately, and specialized quality management platforms like Minitab. These tools streamline root cause analysis by offering fishbone diagram templates, collaborative editing capabilities, and integration with business systems, enabling teams across manufacturing, healthcare, and service industries to identify problems faster and implement solutions more effectively.
Cause and effect diagrams align perfectly with Six Sigma's systematic problem-solving approach by supporting the Define, Measure, and Analyze phases through structured root cause identification. These diagrams enable Six Sigma teams to categorize potential causes systematically, prioritize investigation efforts, and maintain data-driven focus, with manufacturing and service organizations finding that this combination delivers faster problem resolution and sustainable process improvements.
-
Very unique, user-friendly presentation interface.
-
Easily Editable.
-
Wonderful templates design to use in business meetings.
-
Qualitative and comprehensive slides.
-
Thanks for all your great templates they have saved me lots of time and accelerate my presentations. Great product, keep them up!