The 7 Quality Control (QC) Tools are fundamental instruments in quality management, offering structured methodologies to analyze and improve processes. These tools include histograms, control charts, Pareto diagrams, cause and effect, and stratification to enable efficient data interpretation and decision-making.
Integrating SlideTeam's PPT templates with these QC tools significantly enhance their effectiveness. Our templates provide a visually appealing and organized platform to present data, trends, and results from these tools. This integration simplifies data into clear, engaging visuals, ensuring that the insights obtained through the 7 QC tools communicated to teams and stakeholders with ease.
Secure the Top 5 Quality Inspection Report Templates with Samples and Examples - Your Essential Guide. Download Now.
Furthermore, with our presentation designs, the impact of these invaluable QC Tools is maximized, facilitating a seamless understanding and facilitating informed actions for process improvement and quality enhancement.
Explore Top 10 Control Chart Templates with Samples and Examples Tailored to Your Requirements. Click to Download.
Let’s begin!
Template 1: 7 QC Tools PowerPoint Presentation Slides
This presentation slide is a well-created digital source that outlines the concept of 7 QC Tools to your audience. These tools are essential in assisting businesses with their development and improvement processes. Besides this, they empower organizations to tackle challenges effectively and make data-driven decisions, ultimately contributing to the overall development and success of the business. So, download now and get started!
Template 2: Cause & Effect Diagram (Fishbone Diagram)
This PPT Slide represents the cause-and-effect diagram (fishbone diagram). It shows how to identify the problems and come up with solutions. The key aspects covered in this presentation are measurement, materials, method, environment, workforce, and machine. Besides this, it also highlights information about the problem statement. This presentation template for fishbone diagrams is a valuable tool for businesses to analyze and solve problems effectively, improve processes, enhance quality, and drive continuous organizational improvement. Go ahead and download it as soon as possible.
Template 3: Check Sheet Template
This pre-designed PPT template is helpful when you are looking to create a check sheet. It enables you to gain a competitive edge by understanding defect types and recording event occurrences. It is available with other valuable details such as the project name and the name of the data recorder, location, and data collection dates. So, don't wait much. Download this presentation slide now and deliver a statement!
Template 4: Histogram Template
This PPT slide provides an opportunity to track the performance of the products. It encompasses critical aspects that make it easier for the end user to understand the information as a line graph. In addition, it also enables you to highlight the comparison between two products, understand which one is performing better, and then make changes in your promotion strategy. Download this valuable resource today for your convenience.
Template 5: Pareto Chart Template
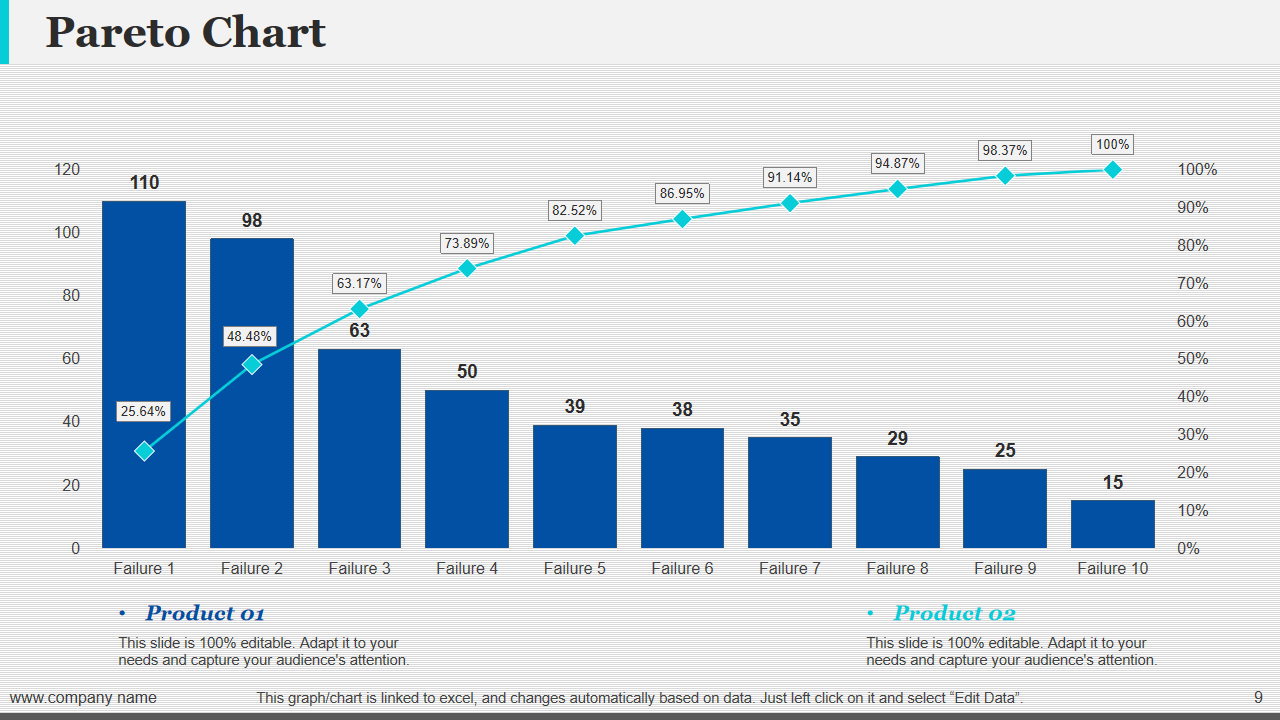
This ready to use PowerPoint slide helps to highlight the concept of the Pareto chart based on the 80/20 rule, which states that roughly 80% of the effects come from 20% of the causes. It enables corporate leaders and professionals to share a strong statement highlighting that approximately 80% of the issues, problems, or results are attributed to about 20% of the factors. Download now and start delivering the information effectively.
Template 6: Scatter Diagram Template
This PPT slide provides a structured framework to share details about valuable tools for visualizing data relationships and identifying outliers or patterns within the data. This presentation template allows businesses to analyze data relationships, detect anomalies, make informed decisions, and enhance processes and quality, contributing to overall organizational success. These aspects are critical for business development. Make this PowerPoint slide a part of your presentation quickly.
Template 7: Stratification Template
This presentation template helps organize data meaningfully, making it easier to pinpoint the sources of variation and concentrate efforts on areas that will yield the most significant improvements. The PPT slide shows differences between the purity percentage and iron (parts per million) in the products. It also helps to exhibit details about reactors. This PowerPoint covers every aspect professionally. Download and make it a part of your presentation now.
Template 8: Control Charts Template 1
This pre-designed presentation template helps identify variations in a process and distinguish between normal variations and unusual events that may need immediate attention. It includes an accurate control chart, upper control limit, and lower control limit. It is helpful for industries to monitor and improve processes, ensuring consistent and high-quality output. Furthermore, it is also helpful to monitor and visualize process performance over time and determine whether a process is in a state of statistical control. Download it today!
Template 9: Control Charts Template 2
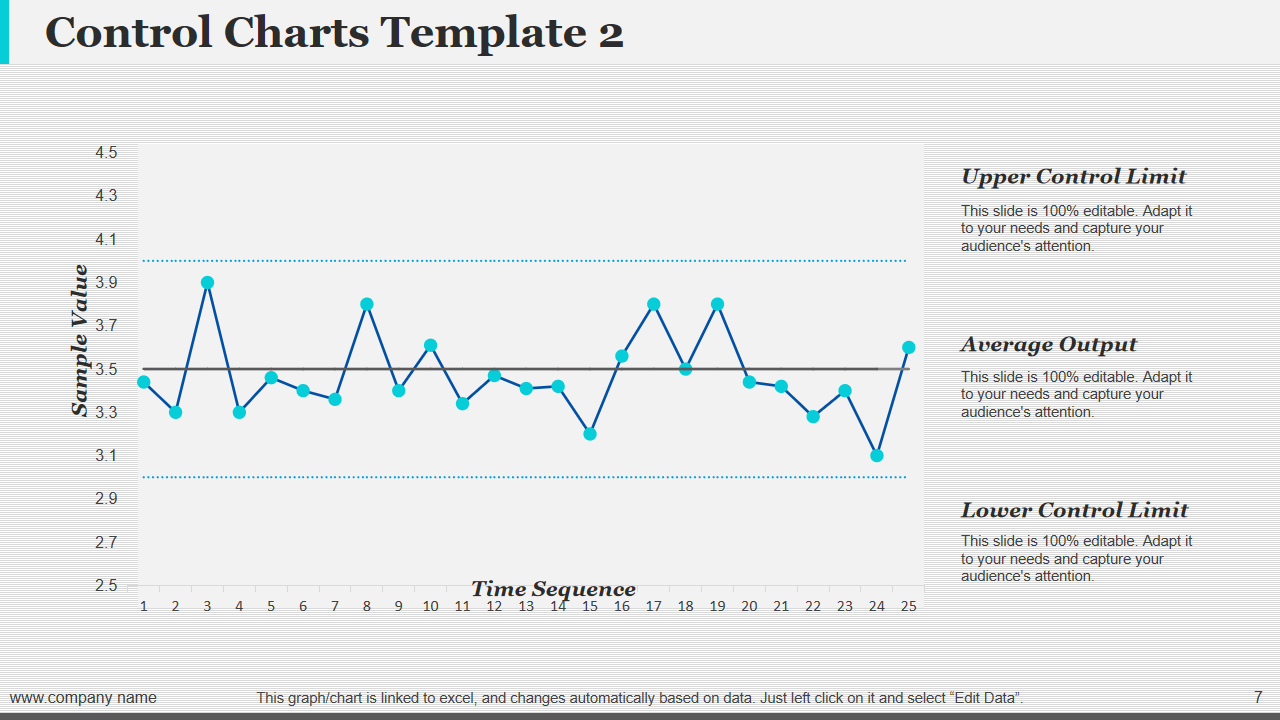
This PPT layout helps to show how control charts play a crucial role in ensuring process stability, promoting a culture of continuous improvement, and aligning processes with quality goals and customer expectations, especially in the context of quality control and process improvement. It covers time sequence, upper control limit, average output, and lower control limit. This presentation slide empowers stakeholders to manage and enhance processes in an effective manner.
Mastering Excellence: Unveiling the Vitality of the 7 QC Tools for Quality Triumph
The 7 QC tools are vital for enhancing operational efficiency and quality in various processes. These tools offer a structured approach to analyzing data and drive informed decision-making. Equally important is effectively presenting insights derived from these tools. PowerPoint templates are crucial here, providing a visually appealing format to showcase data, trends, and conclusions.
By using presentation templates strategically, complex information becomes more accessible and engaging, maximizing the impact of the insights gained from QC tools. Integrating the analytical strength of QC tools with the illustrative power of PowerPoint templates empowers organizations to achieve continuous improvement and elevate overall quality.
Access In-Depth Insights on Project Quality and Download Relevant Templates Today.
FAQs on QC Tools
Why 7 QC tools are used?
Businesses have numerous incentives to utilize the 7 QC tools, some of which are highlighted below:
- Enhances product quality.
- Facilitates identification and analysis of process-related issues.
- Utilizes Fishbone training to support Kaizen (Continuous Improvement).
- Promotes a sense of teamwork.
- Provides an effective method for addressing potential problems.
- Fishbone training is dedicated to identifying the root causes of problems.
- Offers suggestions for areas of improvement.
- Elevates levels of customer satisfaction.
Which are the 7 QC tools?
The 7 QC Tools are fundamental, easily understandable, and widely employed for improvement initiatives. The following tools constitute the 7 QC Tools:
- Cause and Effect Diagram (Fishbone)
- Check Sheet
- Control Charts
- Histogram
- Pareto Chart
- Scatter Diagram
- Stratification
What is a scatter diagram in 7 QC tools?
A scatter diagram, one of the 7 QC tools, visually represents the correlation between two variables. It plots data points on a graph, each axis representing a different variable. It allows for quickly identifying patterns and trends, aiding in data analysis and decision-making for quality improvements.


 Customer Reviews


