

Tools Of Quality Management Powerpoint Presentation Slides




Try Before you Buy Download Free Sample Product
 Impress Your
 Audience
 100%
100% Editable
 Save Hours
 of Time


Use Tools Of Quality Management PowerPoint Presentation Slides to identify problems and solve those defects. Ensure quality assurance in various processes and projects with the help of essential quality control tools PPT templates. This content-ready QC control PowerPoint deck covers tools like pareto chart, flow chart, control chart, fishbone diagram and more. Not just this, use quality control check sheet to analyse the overall operation of the processes. Keep a tab on the quality check to ensure that the product or service that is delivered is fit for the customers. Plan and control activities during the quality control check by incorporating ready-to-use quality control PowerPoint templates. Meet the customers’ expectations and improve the defects in the processes with the help of tools of quality management PPT slides. Download this ready-made quality management PowerPoint templates and shed light on the critical issues to resolve them quickly using essential quality control tools. Our Tools Of Quality Management Powerpoint Presentation Slides will fulfill your expectations. They are designed with your comfort in mind.
People who downloaded this PowerPoint presentation also viewed the following :
Content of this Powerpoint Presentation
Slide 1: This slide introduces Tools Of Quality Management. State Your Company Name and begin.
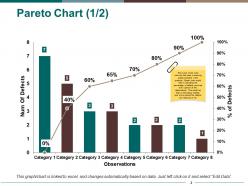
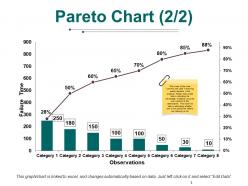
Slide 2: This slide showcases Pareto Chart (1/2). This is one of the most common tool used in ensuring quality standard in the products. Pareto chart would help in indicating the percentage of defects occurred over a period of few observations. This would be help in estimating whether over a time period the defects are reducing or not
Slide 3: This is one of the most common tool used in ensuring quality standard in the products. Pareto chart would help in indicating the percentage of defects occurred over a period of few observations. This would be help in estimating whether over a time period the defects are reducing or not.
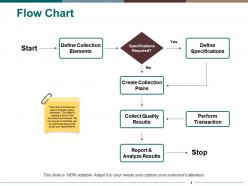
Slide 4: This slide presents Flow Chart. Flow chart is another tool used in maintain quality standards. This helps in creating a flow for the activities to be followed. We have given an example, you can edit these data points as per your requirements.
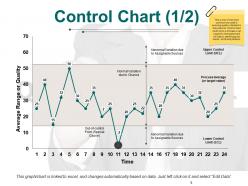
Slide 5: This slide shows Control Chart (1/2). This is one of the most common tool used in ensuring quality standard in the products. Control chart would show a process over a specific time period and will help in identifying the trends, shifts and patterns.
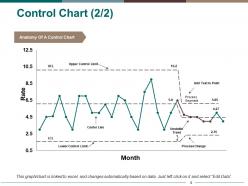
Slide 6: This slide presents Control Chart (2/2). Use it as per your own requirement.
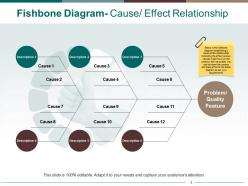
Slide 7: This slide presents Fishbone Diagram- Cause/ Effect Relationship. This is the fishbone diagram establishing a cause effect relationship indicating the effect various causes might have on the product/ service quality. You can list down the causes and there effect in the below diagram as per your requirements
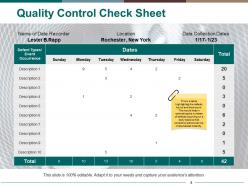
Slide 8: This slide Quality Control Check Sheet. This is a table highlighting the defects found and their count. This would help in estimating the numbers of defects occurring on a daily basis so that corrective actions can be implemented instantly.
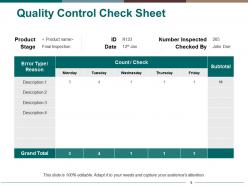
Slide 9: This slide showcases Quality Control Check Sheet with table. You can add the product, error type or reason.
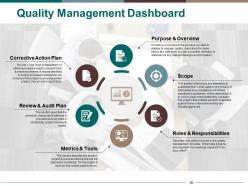
Slide 10: This slide presents Quality Management Dashboard with these six factors.
Slide 11: This is a Coffee Break slide to halt. You may change it as per requirement.
Slide 12: This slide presents Tools Of Quality Management Icon Slide.
Slide 13: This slide is titled Charts & Graphs to move forward.
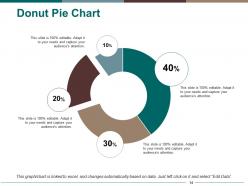
Slide 14: This slide presents Donut Pie Chart. You can edit the percentage and add as per you want.
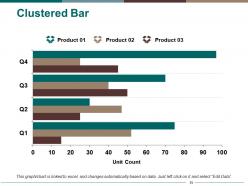
Slide 15: This slide showcases Clustered Bar.
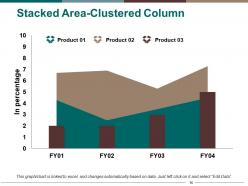
Slide 16: This slide showcases Stacked Area-Clustered Column,
Slide 17: This slide is titled Additional slides.
Slide 18: This is a Vision, Mission and Goals slide. State them here.
Slide 19: This is an About Us slide showing Our Company, Value Client, and Premium services as examples.
Slide 20: This is an Our Team slide with name, image&text boxes to put the required information.
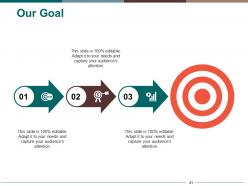
Slide 21: This slide shows Our Goals for your company.
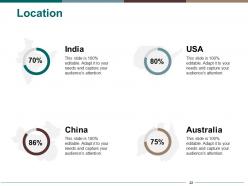
Slide 22: This is a Location slide of World map to show global presence, growth etc.
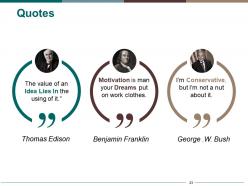
Slide 23: This is a Quotes slide to convey message, beliefs etc.
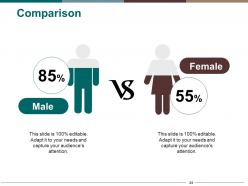
Slide 24: This slide shows Comparison of number of users and Time.
Slide 25: This slide displays a Magnifying Glass with icon imagery.
Slide 26: This slide displays a Bulb or idea image.
Slide 27: This is a Thank You image slide with Address, Email and Contact number.
Tools Of Quality Management Powerpoint Presentation Slides with all 27 slides:
Draw inspiration from our Tools Of Quality Management Powerpoint Presentation Slides. Get imaginative ideas for any design features.



FAQs for Tools Of Quality Management
So Six Sigma, Lean, and ISO 9001 are pretty much everywhere - those three dominate quality management. Most places throw in statistical process control for monitoring stuff, plus root cause tools like fishbone diagrams. Process mapping's huge too. My old manager was obsessed with control charts, but honestly? Pick one system and actually stick with it instead of bouncing around every quarter. You'll hit quality audits and FMEA depending on your industry. Oh, and failure mode analysis if you're in manufacturing or whatever. Just build off what you're already doing - way easier than starting from scratch.
So these tools are basically your safety net for catching problems before they blow up. Fishbone diagrams are clutch for finding the real issue instead of just slapping fixes on whatever's obvious. Control charts? Game changer - you'll actually see patterns instead of drowning in random numbers. Honestly, I used to hate data until I started visualizing it properly. The whole thing works because you're constantly checking if your changes actually did anything. Don't overthink it though - just grab a simple process map first and trace how stuff really moves through your department.
So Six Sigma is this data-driven thing for fixing defects and cutting down process variation. DMAIC is the framework everyone uses - Define, Measure, Analyze, Improve, Control. Tons of statistical tools too, like control charts and root cause analysis. Honestly? Don't get caught up in all the belt levels and jargon at first. Just grab one annoying process your team deals with and walk through DMAIC. The real trick is actually doing something with your data instead of just hoarding spreadsheets. Oh, and make sure leadership's really on board - I've seen way too many Six Sigma programs die because management lost interest halfway through.
Honestly, you need both the hard numbers and the softer stuff to see what's actually working. Defect rates and customer satisfaction are obvious ones. Process cycle times too. But don't forget to check if people are even using the tools - I've seen so many companies roll out fancy systems that just collect dust. Set your baselines first, then compare monthly or whatever makes sense. Cost of quality is huge but kinda tricky to calculate sometimes. Employee feedback matters more than most managers think. Start with maybe 3-4 metrics that actually matter to your process instead of going overboard with data.
So basically, quantitative tools are all about the numbers - defect rates, control charts, that kind of measurable stuff. Qualitative tools focus more on the "why" through interviews, focus groups, root cause discussions. Numbers show you what's broken. The other stuff helps you figure out why it broke in the first place. My old manager used to say you need both, and honestly he wasn't wrong. Sure, you could probably get by with just one approach, but you'd be missing half the picture. They work way better together since the data points you toward problems and the qualitative side helps you actually solve them.
So you'll want to match tools to whatever methodology you're already using. Agile teams can drop root cause analysis into retrospectives pretty easily, or track sprint metrics with control charts. Waterfall? Do your quality planning upfront with stuff like FMEA, then monitor execution with statistical process control. Some tools work anywhere though - fishbone diagrams and 5-whys are pretty universal. Don't jam heavy tools into fast sprints, that's just asking for trouble. Look at where your current process has quality gaps first. Then grab tools that actually fit how your team works and reports stuff.
Oh man, there's actually a ton of good stuff out there right now. MasterControl and Veeva Vault are solid if you're in pharma or anything heavily regulated. Qualio and ETQ Reliance work well for most other industries. Honestly, I'd probably just start simple with Monday.com or even Airtable if your needs aren't crazy complex - you can customize those pretty easily. Manufacturing? InfinityQS is what my old company used and it was decent for statistical stuff. The market's pretty flooded which is annoying to research but great for pricing. Make a list of what you actually need first, then trial like 2-3 options.
Honestly, root cause analysis is a game changer because it stops you from just putting band-aids on everything. Instead of fixing the same stupid problems over and over, you actually dig into what's causing them. Think of it like detective work for your business processes. You trace issues back to their real source, then fix that instead. Way better than constantly putting out fires! The five whys technique works great - just keep asking "why" until you get to the bottom of things. Takes more effort upfront but saves you tons of headaches later.
So quality management tools are basically your backup plan for staying compliant. Process mapping makes sure you hit all the required steps, and statistical process control keeps everything consistent - which regulators absolutely love. Document control systems are total lifesavers for keeping records organized and audit-ready. Risk assessment matrices catch compliance gaps before they bite you. Honestly, the trick is just picking tools that match your industry standards - ISO, FDA, whatever you're dealing with. Oh, and don't overcomplicate it.
Dude, training is everything. I've watched companies blow serious money on quality software that just sits there unused because nobody knows what they're doing with it. Your people need to actually get their hands dirty with those statistical charts and root cause stuff - not sit through some boring slideshow. Honestly, half the problem is companies think the fancy tools will magically fix everything. They won't. Figure out what your team doesn't know first, then train them on the specific tools they'll actually use every day. Otherwise you're just buying expensive digital paperweights.
Honestly, the hardest part is getting people to actually use the damn thing. Everyone's so stuck in their old ways, even when those ways suck. Training is huge too - you can't just dump a new tool on people and expect magic. Start with a small group first, maybe your most adaptable team members. Get some quick wins to show it actually works. Oh, and migrating data from your old system? Total pain, budget extra time for that mess. Once a few people see real benefits, word spreads and the rollout gets way easier.
Put up some visual boards where everyone can actually see what's going wrong - defect rates, customer complaints, whatever matters most. No more hiding problems in spreadsheets that nobody checks. When quality issues are right there on the wall, people can't pretend they don't exist. Honestly, it's crazy how much faster teams react when the data's staring them in the face. Your workspace becomes the place where problems get solved instead of shuffled around. Start simple - even a basic quality board changes everything. Trust me, you'll see way better discussions once people stop playing telephone with the numbers.
Honestly, analytics changes everything about quality management. Instead of just reacting when stuff breaks, you'll actually see problems coming. Patterns jump out way faster than the old methods we used to rely on. Real-time data means you're not stuck waiting around for those useless monthly reports anymore - you know what's happening right now. The coolest part? You can predict where defects will pop up and stop them before they even happen. Root cause analysis becomes so much quicker too. My advice though - don't go crazy trying to analyze everything at once. Pick one metric you're already watching and dig deeper into what it's telling you.
Look, just start basic. Grab some free templates online for checklists and process maps - way better than dropping cash on software you'll never actually use. Pick one thing that's bugging you and document the hell out of it. Get your team together for regular check-ins too. I swear, half the businesses I know went crazy buying expensive systems and then... crickets. Root cause analysis forms, customer feedback sheets - all free if you're willing to spend the time. Consistency beats fancy every single time. Better to nail simple quality checks than ignore complicated ones.
Honestly, customer feedback is everything when you're building quality management tools. Without it, you're just guessing at what matters. I've seen teams obsess over internal metrics while completely missing what actually frustrates users day-to-day. Real feedback shows you which quality issues are genuine pain points versus stuff that just looks important in spreadsheets. It helps prioritize what to build first too - no point creating fancy features if they don't solve actual problems. My advice? Set up regular check-ins with key customers. Even quick informal chats can reveal massive gaps in your current processes that you'd never spot otherwise.
-
I discovered this website through a google search, the services matched my needs perfectly and the pricing was very reasonable. I was thrilled with the product and the customer service. I will definitely use their slides again for my presentations and recommend them to other colleagues.
-
Very well designed and informative templates.