


Total Quality Management Powerpoint Presentation Slide


Try Before you Buy Download Free Sample Product
 Impress Your
 Audience
Editable
of Time


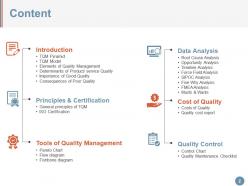
Ensure the quality of your product or service is consistent with our content-ready total quality management PowerPoint presentation slides. These capability maturity model integration presentation slides will help you upgrade the standards of your organization. Our quality improvement PPT presentation will help you enhance the quality of your firm outputs. This content ready quality control PowerPoint PPT covers all the relevant slides such as introduction, TQM pyramid, TQM model, customer focus in TQM, planning process in TSM, process management, business process improvement, involvement of people, TQM elements, determinants of product quality, determinants of service quality, importance of good quality, consequences of poor quality, principles and certification, and tools of quality management. It also includes slide on pareto chart, flow chart, fishbone diagram, data and analysis, root cause analysis, opportunity analysis, timeline analysis, force field analysis, SIPOC analysis, 5 why analysis, failure mode effect analysis, musts and wants, cost of quality, quality cost report, quality control, and quality management dashboard. Using these presentation slides, you can explain the content of quality control and quality assessment. So, quickly download this total quality management presentation PPT. Get them in the groove with our quality management system ppt. Encourage them to follow given directions.
People who downloaded this PowerPoint presentation also viewed the following :
Content of this Powerpoint Presentation
“Quality is never an accident; it is always the result of intelligent efforts” - John Ruskin
An organization that upholds quality confirms that it values its brand image and customer trust above everything.
Therefore as an enterprise, if you want to be remembered for long, you must strive for quality in every business operation. Begin with Total Quality Management (TQM). For those unaware, TQM is a continuous process in which the aim is to detect, reduce, and eliminate errors.
TQM can be used for different purposes, including enhancing product/service quality, offering better customer service, training and updating employees, and optimizing the supply chain.
When done right, TQM can help in the overall development of the organization and its employees. It also helps improve the organization's culture. In many cases, it’ll contribute to long-term success and build long-lasting relationships between customers and organizations.
Several core principles of TQM exist. They include leadership, people involvement, continuous improvement, beneficial supplier relationships, and a factual approach to decision-making. When an organization adheres to these principles, achieving quality in all it does becomes commonplace.
The below-mentioned presentation slides discuss the essentials of TQM and provide a content-ready framework for you to revive quality and maintain it as your brand USP.
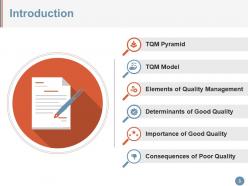
Template 1- TQM Pyramid
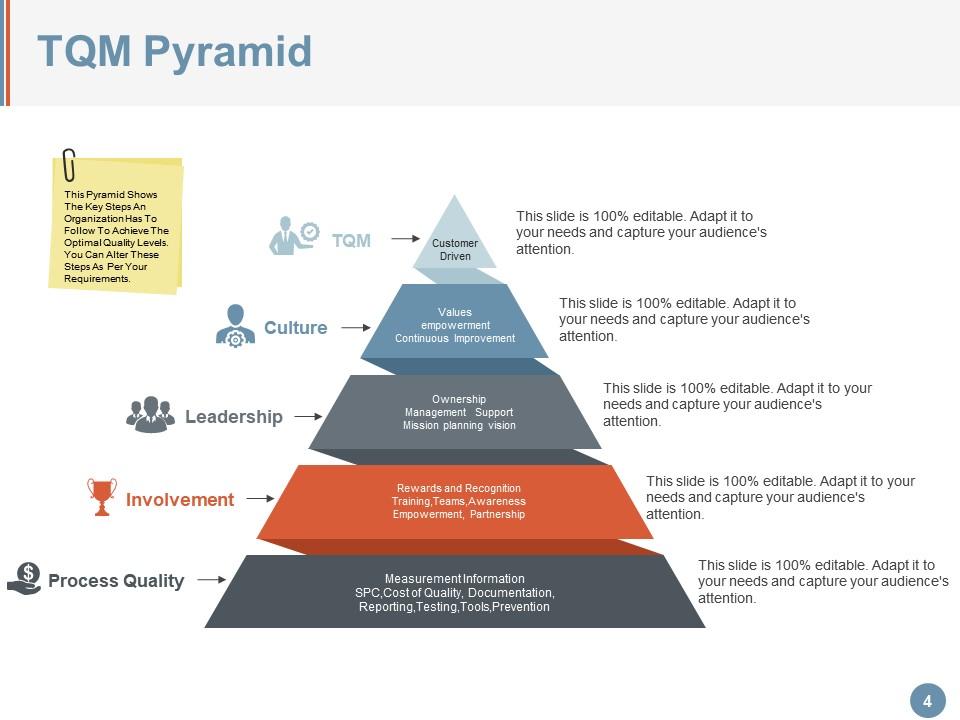
If an organization wants to ensure quality, it needs to follow several steps. SlideTeam's 100% editable PPT Slide mentions some of the critical steps. Examples include documentation, reporting, testing, training, rewards and recognition, and continuous improvement. Though everyone plays a role in quality management, leadership plays a vital role as they offer support to employees, take ownership, and plan the mission and vision precisely. Simplify this concept with this pyramid diagram.
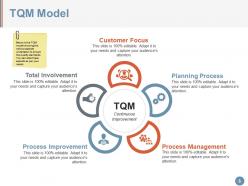
Template 2- TQM Model
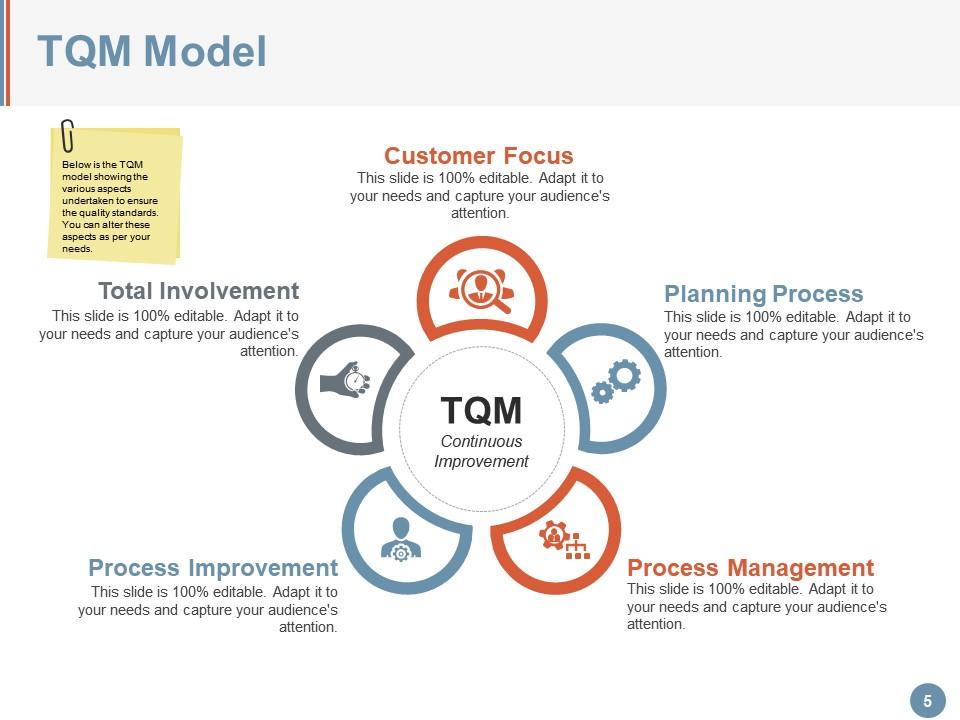
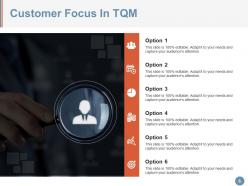
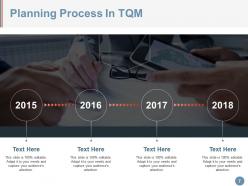
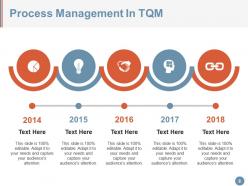
Total Quality Management always means continuous improvement. It is possible by ensuring proper process management, enhancing the planning process, and focusing on customers, process improvement, and total involvement. This creative presentation slide covers all these vital elements. Feel free to add to the sections and make it yours.
Template 3- Involvement of People

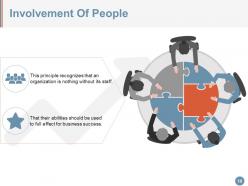
When implementing any change, the role and support of the people involved is critical. So, the focus should be on training the staff and using their respective skills to ensure better quality management. One of the key things that can be done here is to communicate effectively with the people and tell them how they can help and how their contributions will help enhance the quality management process. You can use this PPT Layout to highlight who can help in what manner.
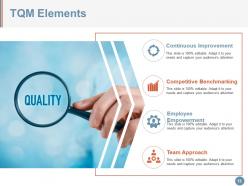
Template 4- TQM Elements

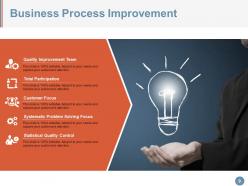
Each quality management process has some essential elements that cannot be ignored. In this PPT Design, the focus is on essential elements such as empowering the employees, ensuring continuous improvement, focusing on competitive benchmarking, and having a team approach. All these factors will help focus on quality without missing the essence of TQM.
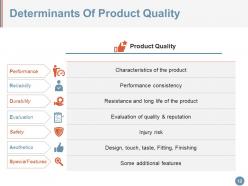
Template 5- Determinants of Product Quality
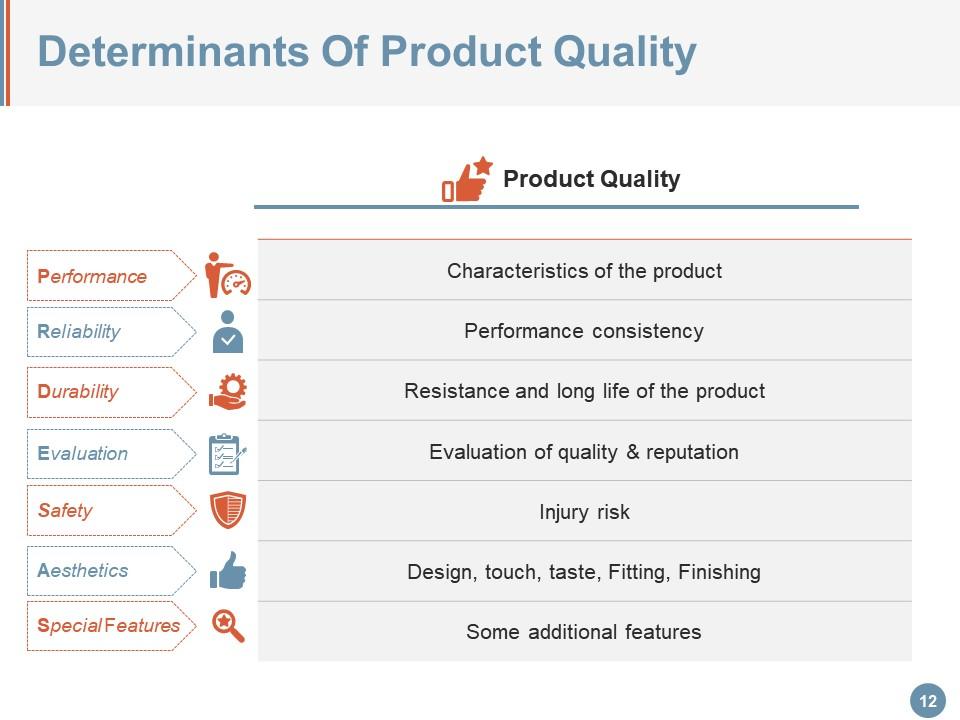
No one can talk about Total Quality Management without considering product quality. This presentation design helps you maintain and enhance product quality by letting you measure each product against key parameters like performance, safety, durability, reliability, aesthetics, evaluation, and special features that make products unique. When you measure all products against these criteria, you will likely develop a high-quality product. Isn't that great?
Template 6- Determinants of Service Quality
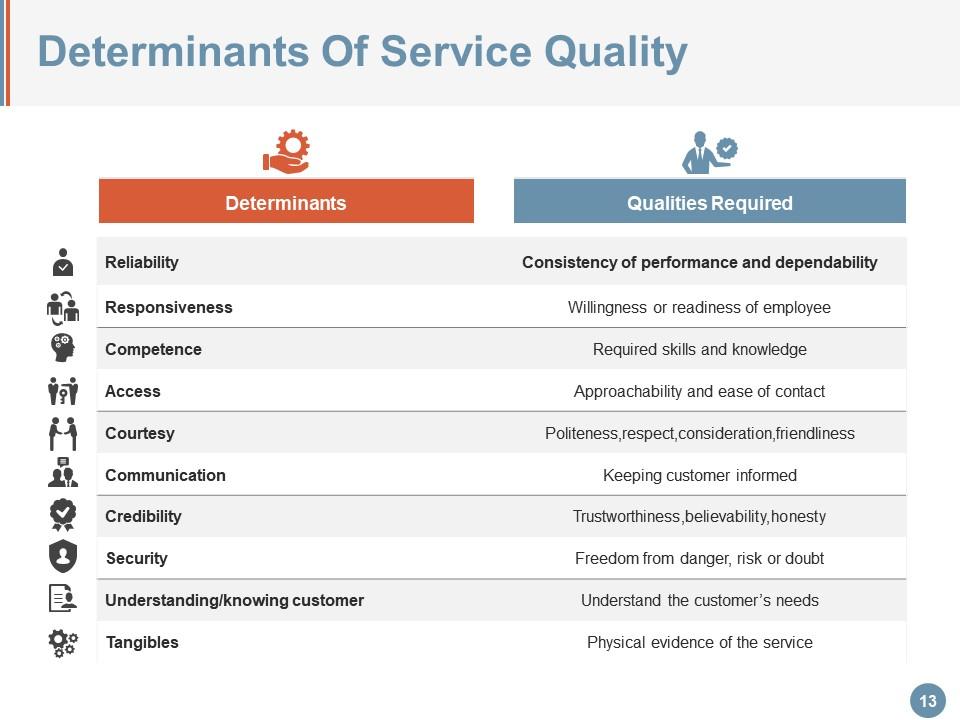
Some organizations are product-focused, while the rest are service-focused. If you only provide services or provide services along with products, you need to know about the determinants of service quality. These include everything from access to reliability, security to responsiveness, and credibility to competence. There are many other parameters, too. Use the ones in the PPT Preset above or edit them as per your unique services. In the end, the goal must be to offer excellent service quality.
Template 7– Importance of Good Quality
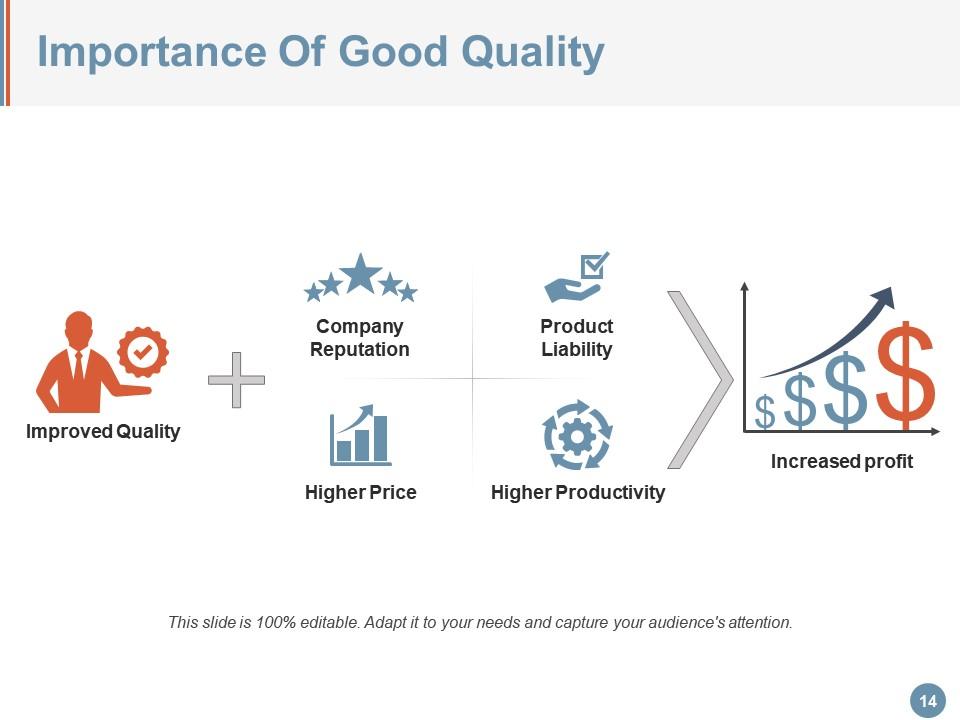
Quality is essential for many reasons. It can provide many benefits to an organization. When you provide quality products or services, your company’s reputation is enhanced. You can also sell the products or services at a higher price. It also leads to product liability and higher productivity. All these factors can together contribute to increased revenue and profits for your company. Focus on these critical factors of TQM in this presentation layout.
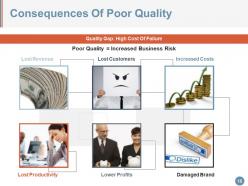
Template 8 – Consequences of Poor Quality
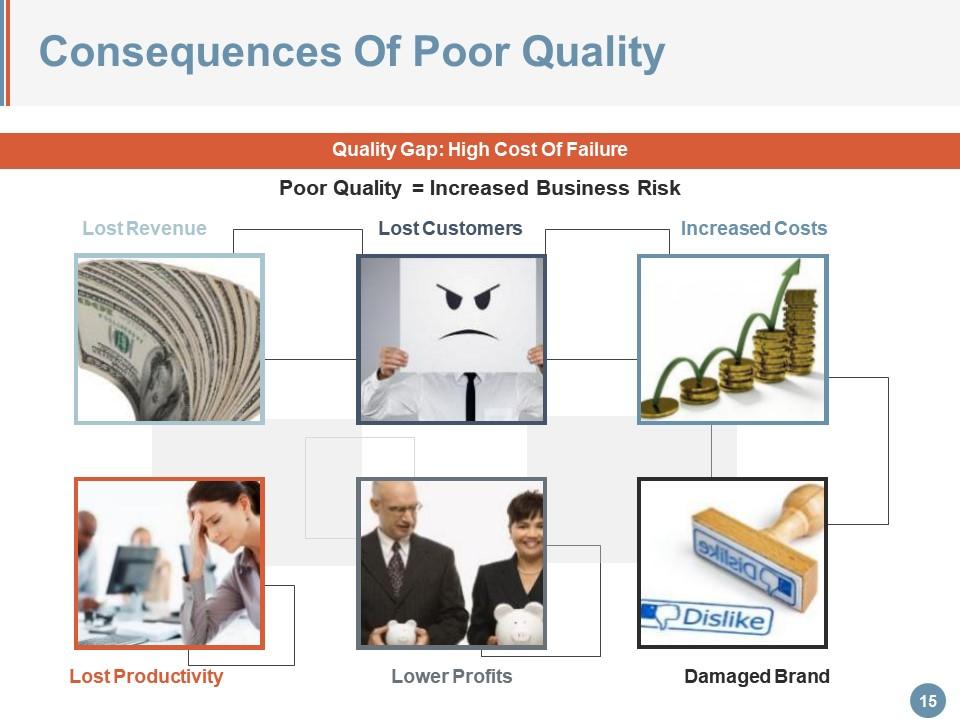
Just as there are many benefits of good quality products and services, there are some disastrous consequences of offering poor quality products and services. Many of them covered in the PPT Slide above are real and can harm you. You might lose customers, revenue, and profit while also having to deal with higher costs, lost productivity, and damaged brand image or reputation. All these reasons might make you more determined never to offer a poor quality product or service.
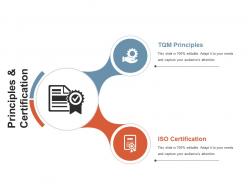
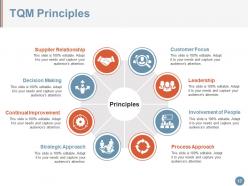
Template 9- TQM Principles
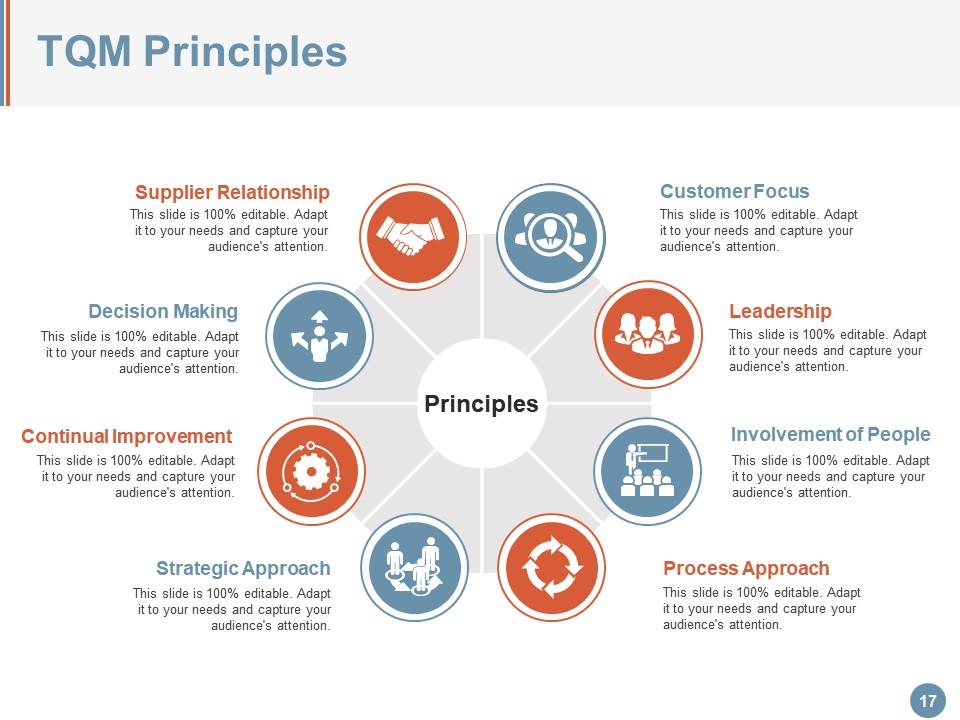
As we mentioned in the introduction, there are a few essential TQM principles. This presentation template explains some of those principles. It covers everything from customer focus to supplier relationships, a strategic approach to decision-making, and leadership to people’s involvement. You can explain each of these principles as per your requirement and add or remove any if you wish.
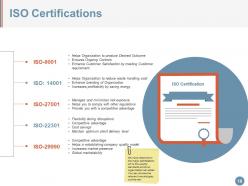
Template 10 – ISO Certifications

Discussing quality seems incomplete without discussing ISO certifications, as they help verify quality. The above presentation template explains several types of ISO certifications. From ISO-9001 to ISO-27001 and from ISO-29990 to ISO-14001, this slide covers the vital ones and explains their purpose as well. Do include them to catch the attention of the audience, as everyone who focuses on quality probably wants an ISO certification and wants to know more.
Final Words
In essence, Total Quality Management has many aspects and the PPT Templates above cover the crucial ones. SlideTeam’s skilled team created these PPT Slides for your convenience. We give you total control to edit and make them your own. Impress everyone in the next TQM meeting or discussion. Download these today!
PS: Check out the deck on ISO-9001 Quality Management System Certification here to speak in detail about this crucial parameter of quality.
Total Quality Management Powerpoint Presentation Slide with all 72 slides:
Analyze the dichotomy between facts and fiction with our Total Quality Management Powerpoint Presentation Slide. Insist on giving authentic inputs.


FAQs for Total Quality Management
So TQM is basically about getting everyone obsessed with quality, not just your QC people. Customer focus is huge - they're paying the bills after all. Give your employees real power to actually fix stuff when they see problems, because nothing's worse than knowing something's broken but not being able to touch it. You'll want continuous improvement baked into everything, plus use actual data instead of just guessing what's working. Leadership has to be all-in from day one. Don't forget your suppliers either - half your headaches probably start there anyway. Pick one department first and nail it before going company-wide.
So TQM puts customers first in everything you do, which obviously makes them happier and more loyal. Your whole team focuses on improving stuff constantly, so you're delivering better products and services. Customers definitely notice that. The cool thing is TQM means you actually listen to feedback and do something about it - not just stick it in some forgotten spreadsheet. Makes your company way more responsive to what people want. Happy customers become your best advertisers too, honestly. I'd start by figuring out where customers interact with you most and focus quality improvements there first.
Look, leadership totally makes or breaks this stuff. You've got to actually walk the walk - not just say quality matters while secretly pushing everyone to rush through things when deadlines hit. Been there, seen that disaster play out too many times. Give your people the training and resources they need upfront. When someone does solid work, make sure they get recognized for it. That's how careers should advance, right? The trick is staying consistent even when pressure builds. If you keep flip-flopping between "do it right" and "just get it done," nobody will take the quality thing seriously.
So TQM and Kaizen work really well together - TQM is like your overall quality philosophy (you know, customer focus, getting employees involved, making decisions based on actual data). Kaizen is more the day-to-day stuff where your team makes small improvements constantly. Honestly, TQM without Kaizen feels kinda useless to me. It's like having this great strategy but no way to execute it. The cool thing is how Kaizen's little changes add up to support TQM's bigger quality goals. Maybe pick one tiny process your team can improve this week and see how it goes?
Start with customer satisfaction surveys and defect tracking - those'll give you the clearest picture. SPC charts are amazing for catching variations before they become real problems, though they take a minute to figure out. Your employees' feedback is gold since they're dealing with issues daily. I'd also track cycle time and first-pass yield rates. Cost of quality metrics help too - basically comparing what you spend preventing problems vs fixing them later. Pick maybe 2-3 metrics that match your biggest customer complaints first. You can always add more later, but trying to measure everything right away is just overwhelming.
Honestly, just get your people actually doing the improvement stuff instead of sitting through meetings about it. Let them own the quality projects - they can spot problems and fix things way better than management thinks. Those cross-department teams are gold because everyone's tired of working in silos anyway. Training helps obviously, but recognition is huge. Like, call people out publicly when they improve something. Don't make quality just another top-down thing - that never works. Oh, and here's what I'd do first: ask your team what process bugs them most and start there.
Honestly, most TQM failures come down to people hating change and leadership not really being on board. Employees get stuck in their comfort zones - can't blame them though. Middle managers have it worst since they're squeezed between old ways and new expectations. Organizations also mess up by expecting quick results when TQM is more like... a marathon, not a sprint. The rushing thing kills so many initiatives. Start with small pilot programs first - way less overwhelming. And don't even bother unless your leadership is actually committed, not just saying they are.
So TQM shifts the whole quality thing from being just one department's headache to everyone's job. Pretty cool actually - you get less waste, faster processes, fewer screwups. Employees get way more engaged too since they can actually fix problems instead of just watching them happen. The whole continuous improvement thing keeps pushing you forward, which obviously makes customers happier and boosts productivity. Oh and pro tip - don't try to do everything at once. Pick one process first and test it out there. Way less overwhelming that way.
They actually work great together! Think of TQM as your big picture philosophy. Then ISO handles all the documentation and structure stuff. Six Sigma brings the heavy-duty analytics when you need to really dig into problems. Honestly, most companies I've seen try to pit them against each other when they shouldn't. Map out where they overlap first - stuff like process improvement and tracking metrics. Then figure out which one tackles your worst headaches right now. You don't have to implement everything at once either. Start with one, get comfortable, then slowly add the others. Way less overwhelming that way.
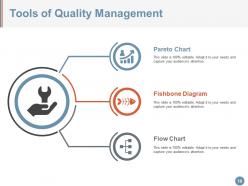
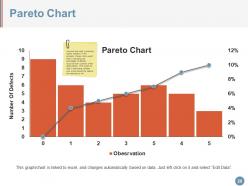
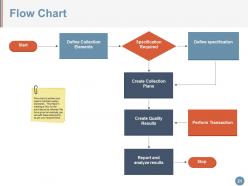
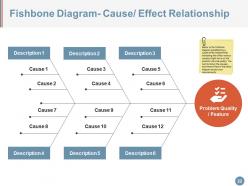
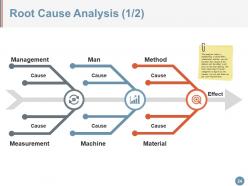
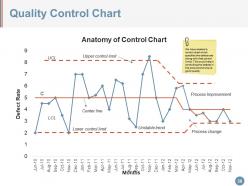
Start with the Seven Basic Quality Tools - they're honestly your best bet. Flowcharts help map out processes, control charts track performance, and Pareto charts show you which problems are actually worth fixing. I'm obsessed with fishbone diagrams for figuring out what went wrong. You'll also want statistical process control and benchmarking stuff. Oh, and some way for employees to share ideas. Don't go crazy trying to do everything though - pick like three tools your team will actually use consistently instead of overwhelming everyone.
Look, your suppliers can make or break your TQM efforts - seriously. If they're shipping you inconsistent stuff, you're already behind. The trick is finding partners who actually give a damn about quality, not just meeting deadlines. Treat them like part of your team instead of random vendors. Get them involved in your improvement processes. I've seen companies waste months trying to fix quality issues that started three suppliers back in the chain. When everyone's on the same page about standards, everything just flows better. Makes a huge difference.
Look, you can't just expect people to magically improve quality without proper training - that's setting everyone up to fail. Most folks resist change anyway unless they get the "why" behind it. Start with your leadership team first, then work down to frontline staff. Cover the basics: quality principles, problem-solving methods, maybe some statistical tools. The trick is keeping it practical, not some boring theoretical workshop. Oh, and make it ongoing - one-and-done training sessions are pretty much useless. People need time to absorb this stuff and see how it applies to their actual daily work.
Dude, the difference is insane. IoT sensors now track quality issues as they happen instead of you finding out days later. AI actually predicts when stuff's about to break before it does - sounds fancy but it works. Your team can collaborate instantly through cloud platforms, and those digital dashboards show everything at once. No more waiting around for weekly reports or drowning in spreadsheets (thank god). The automation handles all the boring routine checks now, so your people can work on bigger improvements. Honestly? Just pick one manual process you're doing and see if you can digitize it this quarter.
Start with baseline numbers before you jump into TQM - customer satisfaction, defect rates, employee engagement, cycle times. Track these consistently. Every quarter, compare where you are now vs where you started. Honestly, the rhythm becomes second nature once you're doing it regularly. Numbers don't tell the whole story though - sometimes everything looks great on paper but people are still pissed off, so grab qualitative feedback too. Build a dashboard your team will actually check, not something that ends up forgotten in some folder. That's the real trick.
Toyota's the classic example - they basically invented lean manufacturing and that whole continuous improvement thing. Motorola actually created Six Sigma (didn't know that until recently), which cut their defects way down. Mayo Clinic does it for patient care, Ritz-Carlton empowers their staff with it. Boeing uses TQM in manufacturing, and Xerox literally saved their company with it back in the '80s. What's cool is none of them just did the typical top-down approach - they got employees involved and actually used data to make decisions instead of just guessing.
-
very usefull for classes
-
Very unique, user-friendly presentation interface.
-
Editable templates with innovative design and color combination.
-
Ok