

Central And South America Map Powerpoint Ppt Template Bundles




Try Before you Buy Download Free Sample Product
 Impress Your
 Audience
 100%
100% Editable
 Save Hours
 of Time


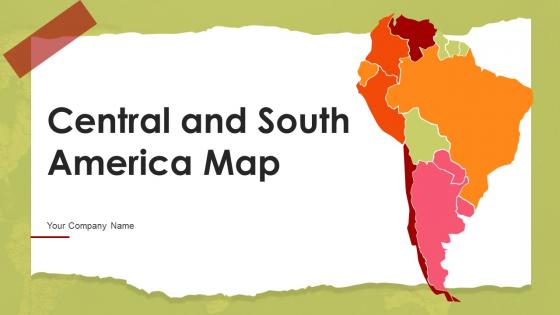
Our Central And South America Map Powerpoint Ppt Template Bundles are topically designed to provide an attractive backdrop to any subject. Use them to look like a presentation pro.
People who downloaded this PowerPoint presentation also viewed the following :
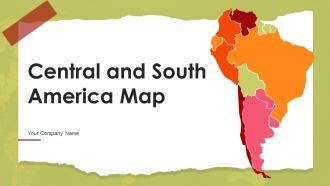
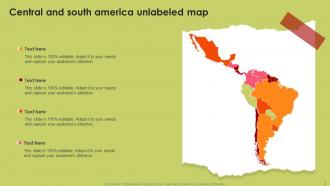
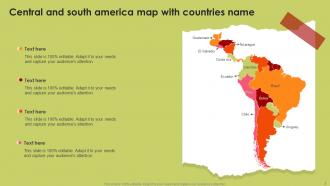
Central And South America Map Powerpoint Ppt Template Bundles with all 9 slides:
Use our Central And South America Map Powerpoint Ppt Template Bundles to effectively help you save your valuable time. They are readymade to fit into any presentation structure.






FAQs for Central And South America Map Powerpoint
Look for ones with clear country labels and major cities marked. Customizable colors are key so you can highlight whatever regions matter for your presentation. High-resolution graphics are a must - nothing worse than pixelated maps on a projector. Make sure text stays readable from the back row. Individual country slides are super handy if you need to dive deeper into specifics. I'd grab templates with the Amazon, Andes, and other major geographical features already marked. Oh, and get something editable so you can drop in your own data points or routes later. Trust me, you'll probably want to tweak things once you start putting it together.
Maps are honestly game-changers for presentations. Your audience can actually see where you're talking about instead of trying to remember if Ecuador is next to Colombia or whatever. Way better than staring at boring bullet points! You can color-code different regions, add little callouts for your main points. People follow along so much easier when there's something visual to anchor the info to. Plus it shows relationships between countries that you might not think about otherwise. I'd definitely highlight the areas you care most about - keeps everyone focused on what actually matters for your presentation.
Honestly, earthy colors are your best bet for Central/South America maps. Warm greens for countries, blues for water - you know, colors that actually make sense geographically. Browns and oranges work great for elevation stuff too. Ocean blues with forest greens is such a solid combo, like the map's telling its own story. You could do monochromatic instead - different shades of green or blue look really clean. Just don't go crazy with neon colors or anything too bright. People expect South America to look, well, like South America. Oh, and definitely test everything on your projector first - learned that one the hard way!
Yeah absolutely go with the big central map layouts - they're perfect for showing off those crazy coastlines and borders. Skip templates with tons of text boxes since they'll just clutter up all the geographical stuff. Side panels work great for legends and data callouts though. Oh and avoid those busy backgrounds that clash with your map colors - learned that one the hard way lol. Keep it simple honestly, the region's already got such distinct features that speak for themselves. I'd start with a clean single-slide layout and add elements as you need them.
Oh definitely, you don't want to do that typical American thing where everything looks super generic. Use colors that actually fit the region - those vibrant oranges and deep blues, earthy tones that feel right. Spanish and Portuguese place names instead of the anglicized versions (seems obvious but people mess this up all the time). Indigenous patterns or local architectural stuff works way better than random clipart. Even fonts matter - skip the boring corporate ones for something with actual character. Honestly, just research the specific countries you're covering and let their visual style guide you instead of defaulting to those awful PowerPoint templates.
Dude, go with vector maps for sure. They won't get pixelated when you resize them, which is clutch for presentations. I made that mistake once - had this blurry mess of a map during a client meeting and felt like an idiot. Raster images look terrible when you blow them up, but vectors stay crisp no matter what. You can also tweak individual countries and change colors easily. For your Central/South America thing, vectors are definitely the way to go. Your presentations will look way more professional, trust me.
Try animating your map elements one at a time - borders first, then cities and trade routes. "Fade" or "Fly In" effects work well without looking too cheesy. I'm obsessed with using "Appear" with tiny delays because it actually keeps people watching. You could show different regions separately to tell a story, like economic data moving north to south. Keep timing around 0.5-1 seconds between elements so it doesn't feel weird. Oh, and don't make every entrance the same or it gets boring fast.
Honestly, population density is your best bet for Central/South America maps - those major cities really stand out. Climate zones are perfect too since you've got insane variety, from Amazon rainforest down to Patagonian desert. I'd throw in natural resources like oil and minerals because they tell the whole economic story visually. Infrastructure stuff like ports and highways looks impressive to executives. Just don't go crazy with too many layers or it'll look like a mess. Stick with population plus maybe one economic thing - that combo usually works really well and doesn't overwhelm people.
Totally! White text with dark outlines is your best friend here - shows up on almost any background. Try to keep labels horizontal because tilted text makes people crane their necks weird. For bigger countries, put the names right inside the borders. Smaller ones? Use those little leader lines pointing from outside. Central America's gonna be tricky since those countries are basically dots on most maps - maybe do callout boxes for those. Oh, and pick either full names OR abbreviations, not both mixed together. Looks sloppy otherwise. If you're presenting, test it on the actual projector first. Trust me on that one.
So definitely add alt text to your map stuff and use high contrast colors that colorblind people can actually see. Don't just use colors to show information - always add text labels too. I totally bombed a presentation once because of this! Include a quick text summary of the main points you're covering. PowerPoint has this accessibility checker thing that's actually pretty helpful for catching random issues. Oh and describe what you're pointing at while you present - honestly this helps everyone follow along better, not just people with vision issues.
SlideModel or TemplateMonster are your best bet - their map templates are solid and editable. CIA World Factbook has surprisingly good free ones too. PowerPoint's built-in map charts work if you just need basic outlines. Oh, and Wikipedia Commons has decent vector maps you can grab. Honestly, if this is for work, just spend the $10-20 on a paid template. Trust me on this one - it'll save you so much time later. Free stuff always ends up needing tweaks. Just watch out for border disputes in some regions... those can get messy real quick.
Okay so first thing - stick to one theme per slide because mixing economic and cultural data just turns into a hot mess. For colors, go with stuff that makes sense like green for growth or warm tones for population density. I always throw in some callout boxes too since honestly, most people won't figure out what the map's showing on their own. Don't forget contrasting colors and clear legends on your Central/South America template. Oh and definitely do a "key takeaways" slide right after - it connects your visual back to whatever point you're actually trying to make.
Dude, interactive maps are game-changers for presentations. Your audience actually pays attention instead of zoning out completely. Add some clickable regions or hover effects to that Central/South America template - people love exploring stuff themselves. I've watched boring geography talks become genuinely interesting once you can click around and discover data. Progressive animations work great too, like revealing trade routes step by step. Honestly, even my most distracted colleagues start asking questions when they can interact with the content. Just throw in 2-3 clickable features and you'll see way more engagement afterward.
Honestly, you'll want current maps because borders and country names shift way more than people realize in Central/South America. Someone in your audience will definitely call you out on outdated stuff - there's always that one geography nerd, you know? Also shows respect for the countries you're talking about and sidesteps political drama. Old maps can have wrong city locations or population numbers too, which just makes you look unprepared. Quick check before presenting saves you from looking like an idiot later.
So first figure out who's actually gonna see this thing. Teachers? Go bright and fun - throw in some clickable country info and maybe climate data overlays. Makes it way more engaging honestly. Business folks are totally different though. They want clean, professional colors and economic stuff like trade routes or market data. Font choice matters more than you'd think - something playful works great for classrooms but looks weird in a boardroom presentation. Just match whatever your audience cares about most, then tweak the colors and data layers from there. Pretty straightforward once you know your crowd.
-
If you have visited their site and failed to find the products, try reaching the customer service because it will be the case that you didn't use the search bar well.
-
My team has been relying on SlideTeam’s professional PPT designs for a while now. It has greatly sped up quality work at my organization. So thanks!