

Présentation PowerPoint de la Banque Commerciale





Try Before you Buy Download Free Sample Product
 Impress Your
Audience
 100%
Editable
 Save Hours
of Time


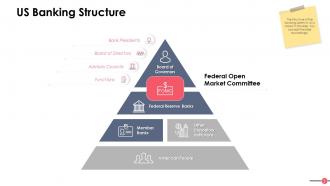
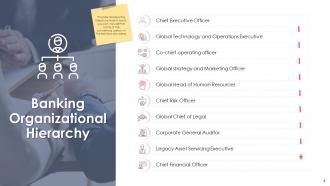
Avec nos 44 diapositives de présentation PowerPoint prêtes pour le contenu de la Banque commerciale, vous pouvez facilement présenter différents sujets liés à la banque commerciale. Cela vous fera économiser de l'argent, du temps et des ressources commerciales car vous n'aurez pas besoin de créer le PPT à partir de zéro. Vous pouvez tirer parti des diapositives PPT de cette institution financière pour comprendre divers sujets tels que la hiérarchie organisationnelle bancaire avec les désignations, la structure bancaire, les principales tendances de l'industrie bancaire, les principaux moteurs de croissance de l'industrie bancaire, les différents services fournis par les banques à ses clients, etc. Ici, nous avons couvert de manière exhaustive chaque aspect de la banque communautaire. Téléchargez notre présentation PowerPoint sur la gestion de trésorerie prête à l'emploi pour naviguer facilement dans la tâche difficile de tout planifier par vous-même. Qu'attendez-vous ? Cliquez simplement sur télécharger et augmentez l'étendue de vos réalisations en utilisant notre présentation bancaire PowerPoint. Donnez un nouvel élan à leurs aspirations. Nos diapositives de présentation PowerPoint de la Banque commerciale les convaincront d'aller encore plus loin.
People who downloaded this PowerPoint presentation also viewed the following :
Contenu de cette présentation Powerpoint
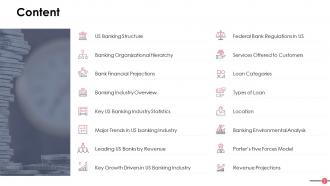
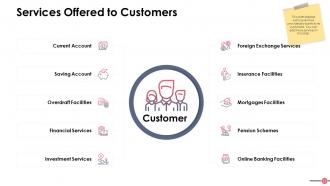
Outre l'apprentissage des principales fonctions d'une banque commerciale telles que les prêts et les emprunts, il est important de comprendre les autres caractéristiques. Les fonctions, les types et les responsabilités de cette institution financière sont responsables de la gestion de l'épine dorsale économique du pays. Pour faciliter les choses, nous avons conçu des diapositives PowerPoint qui expliquent la hiérarchie bancaire, les désignations et les services fournis aux clients.
Pour les informations relatives à la demande de prêt, consultez les diapositives de présentation PowerPoint sur le modèle de proposition de demande de prêt bancaire commercial
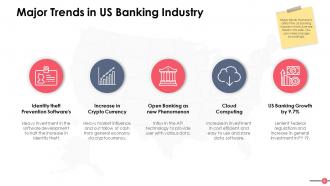
Ces modèles vous aident également à rester au fait des dernières tendances bancaires.
Diapositives de présentation PowerPoint de la banque commerciale
Ces diapositives PowerPoint présentent les perspectives bancaires qui doivent être couvertes pour comprendre le fonctionnement des banques commerciales.
Elles sont 100% modifiables et personnalisables, vous pouvez donc modifier ou ajouter/supprimer des catégories selon les besoins. En utilisant ces modèles, vous pouvez obtenir les ressources bancaires dans un document prêt à l'emploi. Vous pouvez changer la mise en page, les polices, les couleurs, ajouter/supprimer des symboles bancaires (ou des icônes) et en faire le vôtre en quelques minutes.
Jetez également un coup d'œil à ce guide de modèle PPT - Chaîne de valeur de la banque commerciale, y compris la gestion des risques.
Présentation PowerPoint de la Banque Commerciale avec les 44 diapositives.
Permettre des interactions fructueuses avec nos diapositives de présentation PowerPoint de la Banque Commerciale. Permettre aux gens de bénéficier d'un échange d'idées.










FAQs for Commercial Bank
Start with the big financial numbers - ROA, ROE, net interest margin, plus how your loan portfolio breaks down by sector. Executive summary goes first, then market position and competitive stuff. Regulators eat up compliance status and risk management frameworks, so put those early too. Customer acquisition trends matter, along with any digital initiatives you're running. Strategic priorities should get their own section. The whole thing needs to flow like a story about what's driving profits and where growth is headed. Oh, and definitely keep a backup slide with extra data - someone always asks random questions about loan loss provisions or whatever.
Dude, visual design is huge for bank presentations. You build instant credibility when everything looks clean and professional - banking is all about trust, right? Consistent colors and sharp charts prove you're not sloppy with details. Good visuals also help translate those brutal financial numbers into something people can actually digest. I've watched so many presentations crash because they looked thrown together last minute (honestly painful to sit through). Stick to your brand colors, use quality graphics, make charts readable. Your audience will respect you way more from the first slide.
ROE, ROA, and net interest margin are your big three here. Start with ROE since that's what all the executives obsess over. NIM shows how well you're squeezing profit from that spread between deposits and loans - super important for banks obviously. Efficiency ratio matters too (lower's better). Credit quality stuff like NPL ratios work if yours don't suck. Honestly, trending charts over 3-5 years beat static numbers every time. Build your whole story around these metrics and you'll be solid.
Look, compliance is gonna control pretty much everything you put in those slides. Risk disclosures are mandatory - no getting around that. All your financial data has to hit reporting standards, plus you'll be stuck adding footnote disclaimers that nobody actually reads but legal insists on anyway. Capital ratios and stress test results usually need prominent placement too. The whole thing gets pretty heavy with legal jargon, honestly. Oh, and don't forget AML stuff if that applies. My advice? Loop in your compliance people way early - like, before you even start designing. Trust me, you don't want them tearing apart your presentation two days before the big meeting.
Start with the big picture - show them the current risk landscape first, then dive into your specific fixes with real examples. Executives eat up those visual risk matrices and heat maps, trust me. Put actual numbers on everything - dollar amounts, percentages, timelines. I'd avoid the mistake I see constantly where people just dump a bunch of policies without any context. Break it up with bullet points instead of walls of text. Oh, and definitely end each section with who's responsible for what next steps, otherwise nothing actually gets done.
Dude, just build your slides around actual customer stories - like follow "Sarah" from applying for her business loan all the way to opening her second location. People zone out on financial data, but they'll listen when you tell them how your lending saved some local restaurant during COVID. Start each section with something your audience deals with. Real case studies should be your foundation, then attach your product stuff to those stories. Oh and make each slide move the story forward instead of just info-dumping everywhere. Trust me, they'll remember stories way better than boring bullet points. Way better.
Honestly, case studies are game-changers for banking presentations. People's brains just connect better with actual stories than random stats. Like instead of saying "we boosted efficiency 30%" – tell them about that retail client you helped restructure their debt so they could actually grow. Real problem-solving beats generic claims every time. I mean, everyone says they're experts, right? But showing how you walked a struggling business through solutions? That's proof. Grab 2-3 solid client stories that highlight different services you offer. Way more compelling than another slide full of numbers.
Honestly, skip the bullet points and go straight for clean charts and graphs - they're way better for showing trends. Pick 3-4 solid metrics like lending growth or deposit changes over the last couple years. Your data sources need to be bulletproof because executives will 100% grill you on that stuff. Use colors that actually contrast so the trends jump out. Less text is your friend here - let the numbers do the talking. Oh, and don't forget a "so what" slide after your data that connects those market movements directly to what it means for your bank's strategy. That's usually where the real conversation starts anyway.
For banking stuff, PowerPoint's still king - executives expect it and the financial charting is solid. Google Slides is clutch if you're working with a team since everyone can edit simultaneously. Canva makes things look sleek fast, which is nice. Honestly though? I've watched people bomb with Prezi because they got too animated and lost their audience. Banking presentations need to feel trustworthy, not flashy. Clean visuals that don't compete with your data. PowerPoint handles complex charts way better than the alternatives anyway, so unless you have a specific reason to switch, just stick with what works.
Skip the boring mission statement stuff and go straight for real numbers with faces behind them. Before/after photos are money for community projects. Get some employee volunteers to share quick stories - way better than corporate fluff. Charts showing actual environmental wins or lives changed? Perfect. Most CSR presentations suck because they're just walls of text pretending to care. Focus on specifics like "we funded 50 small business loans" then show actual business owners. Keep it visual and real. People connect with genuine stories, not that generic "giving back" nonsense everyone spouts.
Oh man, the worst thing you can do is dump a wall of financial jargon on people without explaining what it means. I've sat through way too many of those - everyone just stares at their phones. Make your fonts big enough that people can actually read them (especially compliance stuff). Those cheesy stock photos of business handshakes? Skip them entirely. You don't need every single metric you have access to either. Pick maybe 3-4 numbers that actually matter for your story. And seriously, test your charts beforehand - if someone in the back row can't read it, it's useless.
Dude, international banking presentations are tricky as hell. Some cultures want all the nitty-gritty data upfront, others need the big picture story first. Colors are weirdly important too - red screams "danger" in some places but means good fortune elsewhere. Religious stuff around interest rates can totally flip how you pitch certain products. Even basic things like handshake photos might fall flat depending on where you're presenting. I learned this the hard way once in Singapore. Research your audience's cultural background before you go in. Trust me, spending that extra prep time will save you from looking clueless.
Skip the boring tables - execs won't even look at them. Try tiered pyramids or those circle diagrams to show your best customers right away. Heat maps are solid for geographic stuff too. I'd go with clean infographics that highlight wallet share and retention rates for each group. Makes it super obvious which segments actually make you money vs the ones bleeding cash. Oh, and definitely include next steps for each segment on one slide - saves everyone the "so what do we do now?" conversation later.
For interactive stuff, I'd throw in some clickable navigation and maybe an embedded loan calculator - people always mess around with those for way too long, which is perfect. Animated charts that build up piece by piece look pretty slick too. You could do a quick poll about banking habits or toss in some hyperlinked case studies. Oh, and interactive timelines showing company milestones work well. But seriously, don't overdo it. Pick like 2-3 things max or it'll feel chaotic. I'd start with just one calculator and see how people respond.
Honestly, stick to the classics first - net interest margin, ROE, ROA, and loan growth. Those show if your bank's actually making money doing bank stuff. Cost-to-income ratio is huge too because investors get excited about efficiency gains. Non-performing loan ratios are critical for asset quality - nobody likes nasty surprises hiding in the loan portfolio. Customer deposit growth and fee income trends help complete the story. Oh, and definitely show 3-5 years of historical data so people can see real trends instead of just random quarterly noise. Makes a huge difference in credibility.
No Reviews