


Consumer Goods Manufacturing Company Profile Powerpoint Presentation Slides


Try Before you Buy Download Free Sample Product
 Impress Your
 Audience
Editable
of Time


Manufacturing refers to processing raw materials into finished goods using equipment, labor, machines, and chemical processing. Grab our expertly designed Consumer Goods Manufacturing Company Profile template. It reveals the company overview with critical products, vision, mission, and core values. The presentation also elucidates the companys geographical presence with Manufacturing facilities and management team. Our Product Manufacturing deck mentions the company products and brands overview with net earnings. It further exhibits the company product analysis with revenue growth and ROA and the timeline from 1992 to 2021. Additionally, our Manufacturing company module shows the business model, covering sustainable development, corporate strategy, etc. Moreover, it emphasizes company financials and M and A deals, including revenue by segment, operating cash flow, and dividends per share. Our Company profile module also mentions the CSR initiatives with a value creation model. Lastly, it showcases the potential export analysis with development opportunities for business investors and dashboards to measure the companys performance. Download our 100 percent editable presentation and get access to our highly researched and skillfully designed company profile ppt products.
People who downloaded this PowerPoint presentation also viewed the following :
Content of this Powerpoint Presentation
Slide 1: This slide introduces Consumer Goods Manufacturing Company Profile. Commence by stating Your Company Name.
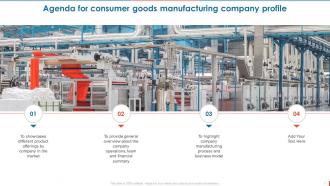
Slide 2: This slide depicts the Agenda of the presentation.
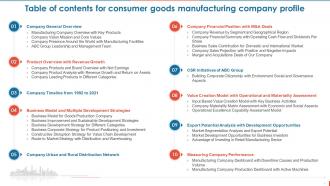
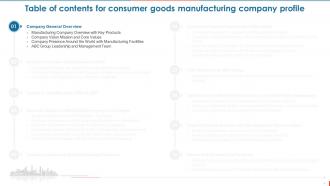
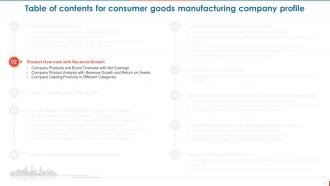
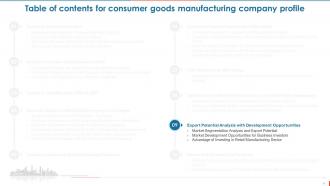
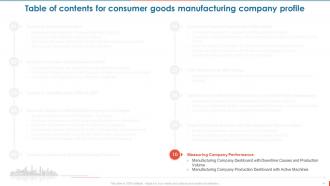
Slide 3: This slide elucidates the Table of contents.
Slide 4: This slide mentions the Title for the Topics to be covered next.
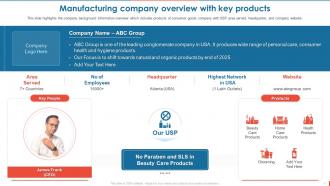
Slide 5: This slide showcases the company background information overview which includes products of consumer goods company with USP, area served, headquarter, and company website.
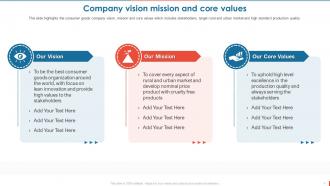
Slide 6: This slide displays the consumer goods company vision, mission and core values which includes stakeholders, target rural and urban market and high standard production quality.
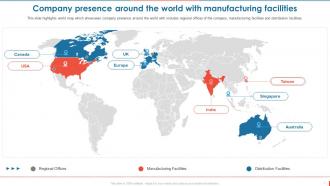
Slide 7: This slide represents the world map which showcases company presence around the world with includes regional offices of the company, manufacturing facilities and distribution facilities.
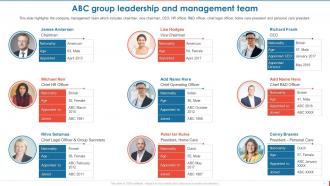
Slide 8: This slide reveals the company management team which includes chairman, vice chairman, CEO, HR officer, R&D officer, chief legal officer, home care president and personal care president.
Slide 9: This slide indicates the Heading for the Components to be discussed next.
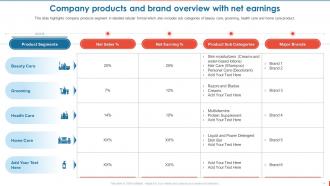
Slide 10: This slide outlines the Company products and brand overview with net earnings.
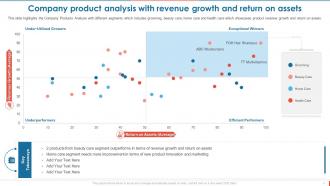
Slide 11: This slide depicts the Company Products Analysis with different segments.
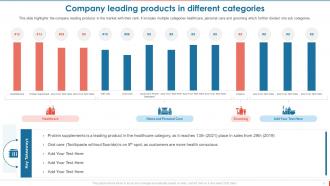
Slide 12: This slide highlights the company leading products in the market with their rank.
Slide 13: This slide exhibits the Title for the Ideas to be covered in the upcoming template.
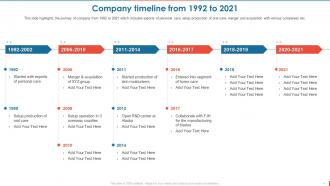
Slide 14: This slide elucidates the journey of company from 1992 to 2021 which includes exports of personal care, setup production of oral care, etc.
Slide 15: This slide portrays the Heading for the Ideas to be covered next.
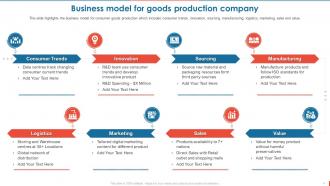
Slide 16: This slide exhibits the Business model for goods production company.
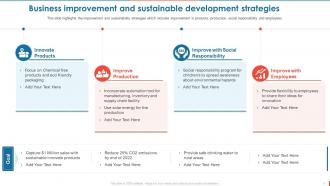
Slide 17: This slide showcases the Business improvement and sustainable development strategies.
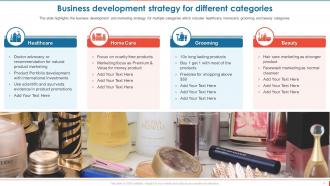
Slide 18: This slide reveals the business development and marketing strategy for multiple categories which includes healthcare, homecare, grooming and beauty categories.
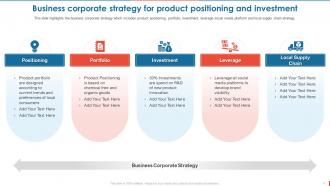
Slide 19: This slide portrays the Business corporate strategy for product positioning and investment.
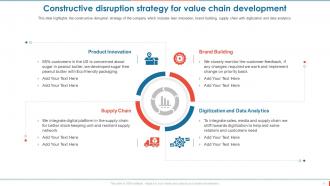
Slide 20: This slide incorporates the Constructive disruption strategy for value chain development.
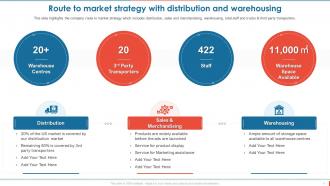
Slide 21: This slide illustrates the Route to market strategy with distribution and warehousing.
Slide 22: This slide presents the Heading for the Topics to be covered in the upcoming template.
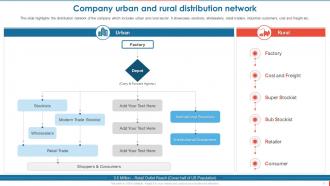
Slide 23: This slide highlights the Company urban and rural distribution network.
Slide 24: This slide reveals the Title for the Components to be discussed next.
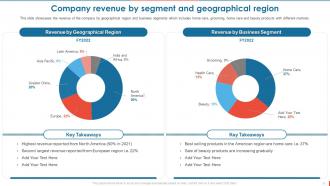
Slide 25: This slide represents the Company revenue by segment and geographical region.
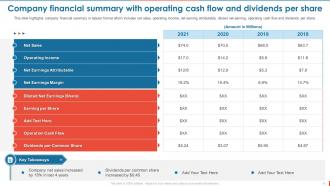
Slide 26: This slide exhibits the company financial summary in tabular format which includes net sales, operating income, net earning attributable, etc.
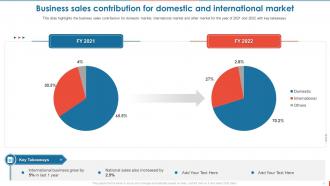
Slide 27: This slide outlines the business sales contribution for domestic market, international market and other market for the year of 2021 and 2022 with key takeaways.
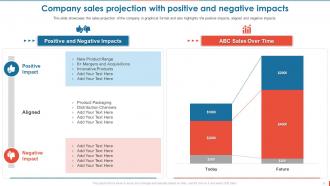
Slide 28: This slide showcases the sales projection of the company in graphical format and also highlights the positive impacts, aligned and negative impacts.
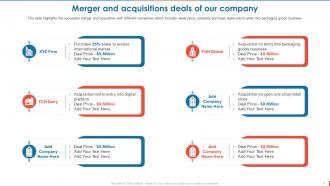
Slide 29: This slide highlights the successful merger and acquisition with different companies which includes deals price, company purchase stake and to enter into packaging goods business.
Slide 30: This slide presents the Title for the Topics to be discussed in the following template.
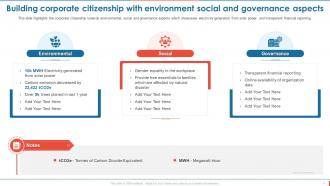
Slide 31: This slide deals with Building corporate citizenship with environment social and governance aspects.
Slide 32: This slide indicates the Heading for the Components to be covered further.
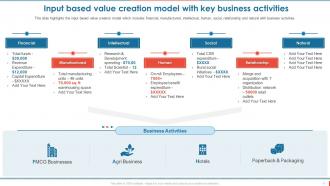
Slide 33: This slide depicts the input based value creation model which includes financial, manufactured, intellectual, human, social, etc.
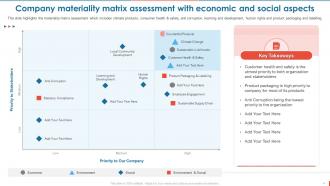
Slide 34: This slide highlights the materiality matrix assessment which includes climate products, consumer health & safety, anti corruption, etc.
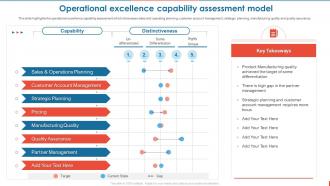
Slide 35: This slide illustrates the Operational excellence capability assessment model.
Slide 36: This slide contains the Main Heading for the Ideas to be discussed next.
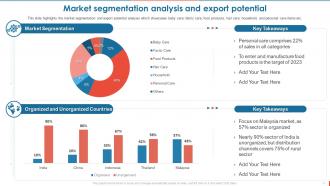
Slide 37: This slide talks about the Market segmentation analysis and export potential.
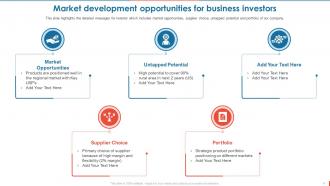
Slide 38: This slide reveals the Market development opportunities for business investors.
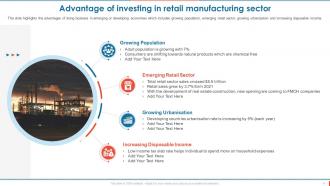
Slide 39: This slide focuses on the advantages of doing business in emerging or developing economies which includes growing population, emerging retail sector, etc.
Slide 40: This slide showcases the Title for the Topics to be discussed next.
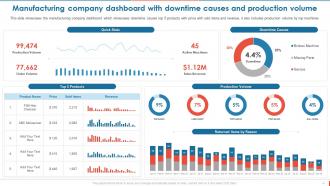
Slide 41: This slide represents the Manufacturing company dashboard with downtime causes and production volume.
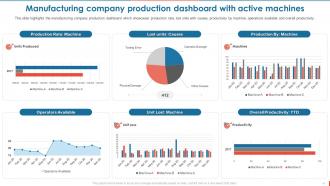
Slide 42: This slide displays the Manufacturing company production dashboard with active machines.
Slide 43: This is the Icon slide containing all the Icons used in the plan.
Slide 44: The purpose of this slide is to depict some Additional information.
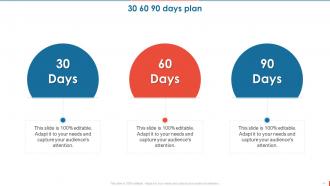
Slide 45: This slide showcases the 30 60 90 days plan for efficient planning.
Slide 46: This is the About us slide. State your Company related information here.
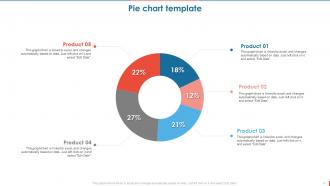
Slide 47: This slide showcases a Pie chart template.
Slide 48: This slide depicts the Pie Chart Template.
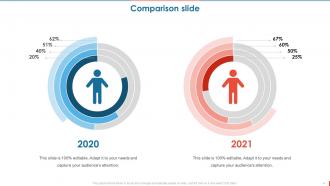
Slide 49: This slide is used for the purpose of comparison.
Slide 50: This slide represents the Retention funnel for customer acquisition.
Slide 51: This slide is used to showcase Organization's mission, vision, and values.
Slide 52: This is the Meet our team slide. State the information related to your team members here.
Slide 53: This is the Puzzle slide with related imagery.
Slide 54: This slide elucidates the Company Roadmap.
Slide 55: This slide presents the Timeline of the organization.
Slide 56: This slide mentions about the Venn diagram.
Slide 57: This slide portrays information related to the Financial topic.
Slide 58: This slide is used for the purpose of Comparison.
Slide 59: This is the Funnel slide with related imagery.
Slide 60: This is the Stacked slide with related imagery.
Slide 61: This is the Thank you slide for acknowledgement.
Consumer Goods Manufacturing Company Profile Powerpoint Presentation Slides with all 66 slides:
Use our Consumer Goods Manufacturing Company Profile Powerpoint Presentation Slides to effectively help you save your valuable time. They are readymade to fit into any presentation structure.


FAQs for Consumer Goods Manufacturing Company Profile
Current trends shaping consumer goods manufacturing include sustainability initiatives, direct-to-consumer sales channels, automation technologies, personalized product offerings, and supply chain digitization. These developments enable manufacturers to reduce environmental impact, enhance customer relationships, and streamline operations, with companies across food, beverage, and personal care sectors finding that strategic adoption ultimately delivers competitive advantage and improved market responsiveness.
Automation and robotics enhance manufacturing efficiency by streamlining production lines, reducing manual labor costs, and minimizing human error while increasing output speed and consistency. These technologies enable manufacturers to optimize resource allocation, maintain 24/7 operations, and deliver higher quality products, with many consumer goods companies finding significant competitive advantages through faster time-to-market.
Sustainability plays a central role in consumer goods production through eco-friendly materials, renewable energy adoption, waste reduction programs, circular economy principles, and sustainable packaging solutions. These approaches streamline operations by reducing resource costs, enhancing brand reputation, and meeting increasingly conscious consumer demands, with many manufacturers finding that sustainable practices ultimately deliver competitive advantage and long-term profitability.
Data analytics drives manufacturing decision-making by providing real-time insights into production efficiency, quality control, demand forecasting, and supply chain optimization. Through predictive analytics and machine learning, consumer goods manufacturers streamline operations, reduce waste, minimize downtime, and enhance product quality, ultimately delivering faster time-to-market and improved profitability.
Supply chain management in consumer goods manufacturing faces challenges including demand forecasting complexities, supplier relationship management, inventory optimization, logistics coordination, and quality control across multiple vendors. These obstacles can significantly impact production timelines, cost structures, and customer satisfaction, with many manufacturers finding that strategic technology integration and diversified supplier networks ultimately deliver enhanced operational efficiency and competitive advantage.
Consumer preferences directly shape product design and development through market research, feedback analysis, trend monitoring, and consumer testing, driving decisions on features, aesthetics, functionality, and pricing. Companies like Unilever and P&G continuously adapt formulations, packaging, and product lines based on evolving preferences, ultimately delivering more targeted offerings and competitive advantage in increasingly dynamic markets.
Globalization significantly transforms consumer goods manufacturing by enabling global supply chains, expanding market reach, reducing production costs through offshore manufacturing, and facilitating technology transfer across borders. While presenting challenges like increased competition and regulatory complexity, it ultimately delivers enhanced operational efficiency, broader customer access, and competitive pricing advantages, with many manufacturers finding that strategic international partnerships accelerate growth and market penetration.
Manufacturers ensure quality control through automated inspection systems, real-time monitoring technologies, statistical process control, supplier audits, and employee training programs. These integrated approaches streamline defect detection, minimize waste, and maintain consistent standards, with food processing, electronics, and pharmaceutical companies finding that comprehensive quality systems ultimately deliver reduced costs, faster production cycles, and enhanced customer satisfaction.
Lean manufacturing principles significantly enhance consumer goods production by eliminating waste, reducing inventory costs, streamlining production processes, and improving quality control. These methodologies enable manufacturers to respond faster to market demands, minimize operational expenses, and deliver consistent product quality, with many consumer goods companies finding that lean approaches ultimately provide competitive advantage through increased efficiency and reduced time-to-market.
Manufacturers can adapt to personalization demand through flexible production lines, modular design approaches, digital customization platforms, advanced data analytics, and on-demand manufacturing capabilities. These strategies enable companies like Nike and Coca-Cola to offer customized products while maintaining efficiency, ultimately delivering enhanced customer satisfaction and competitive differentiation in increasingly consumer-driven markets.
Consumer goods manufacturers leverage IoT sensors, blockchain tracking, AI-powered quality control, automated testing systems, and digital compliance management platforms to enhance product safety and regulatory adherence. These technologies streamline monitoring by providing real-time data collection, predictive analytics for defect prevention, and comprehensive audit trails, with many food and pharmaceutical companies finding that automated compliance systems reduce recall risks while accelerating time-to-market significantly.
Local regulations significantly impact consumer goods manufacturing through product safety standards, labeling requirements, environmental compliance measures, and quality control protocols. Manufacturing companies must adapt their production processes, supply chain management, and documentation systems to meet varying regional requirements, with many organizations finding that proactive regulatory alignment streamlines market entry and enhances competitive positioning.
Best practices for managing labor relations include transparent communication channels, fair compensation structures, comprehensive safety protocols, regular skills training programs, and collaborative problem-solving approaches. These strategies enhance workplace satisfaction by fostering trust, reducing turnover, and improving productivity, with many manufacturing organizations finding that proactive engagement ultimately delivers stronger operational efficiency and competitive advantage.
Manufacturers leverage digital transformation through IoT sensors, predictive analytics, automation systems, supply chain optimization, and customer data platforms. These technologies streamline operations by reducing downtime, accelerating product development, and enhancing customer experiences, with many companies finding that strategic digitization delivers significant cost reductions and faster market responsiveness.
Consumer feedback can be integrated through real-time data analytics, social media monitoring, post-purchase surveys, product testing panels, and IoT-enabled product sensors that track usage patterns. These integration methods enable manufacturers to adjust production schedules, refine product designs, and optimize quality control processes, with companies in electronics and household goods finding that direct feedback loops reduce returns by 30% while accelerating innovation cycles.
-
The team is highly dedicated and professional. They deliver their work on time and with perfection.
-
Impressive templates. Designing a presentation is fun now!