

Dashboard For Customer Segmentation In Marketing Research




Try Before you Buy Download Free Sample Product
 Impress Your
 Audience
 100%
100% Editable
 Save Hours
 of Time


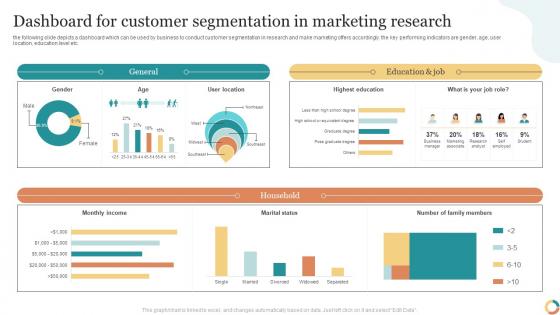
the following slide depicts a dashboard which can be used by business to conduct customer segmentation in research and make marketing offers accordingly. the key performing indicators are gender, age, user location, education level etc.
People who downloaded this PowerPoint presentation also viewed the following :
Dashboard For Customer Segmentation In Marketing Research with all 7 slides:
Use our Dashboard For Customer Segmentation In Marketing Research to effectively help you save your valuable time. They are readymade to fit into any presentation structure.






FAQs for Dashboard For Customer Segmentation
Definitely start with the basics - who your customers are (demographics) and their buying patterns like purchase frequency and average order value. Customer lifetime value is huge too. Then layer in engagement stuff: email opens, website activity, support tickets. RFM scores are honestly where it's at for segmentation - recency, frequency, monetary. Oh and don't skip churn rate or acquisition costs by segment since those hit your wallet directly. Keep it to maybe 6-8 metrics max though, otherwise you'll just get analysis paralysis. Each metric should actually help you do something different with each customer group.
Honestly, visuals are a game-changer for understanding customer segments. Instead of drowning in spreadsheets, you'll actually see the patterns jump out at you. Bar charts show you segment sizes super quickly, and heat maps are perfect for spotting where your customers cluster geographically. I'm obsessed with how fast you can identify your biggest spenders this way. Different age groups' behaviors become obvious too. Plus your boss will love it - everyone gets visuals instantly, even if they hate numbers. Start simple with basic bar charts for size and revenue, then get fancier from there.
Tableau and Power BI are your best bets for this stuff. Tableau's amazing but costs a fortune - Power BI's way cheaper and works great if you're already using Microsoft everything. There's also Looker Studio which is totally free, so that's worth checking out first maybe? Python with Plotly Dash could work too if you don't mind getting your hands dirty with code. I'd figure out what segments you actually need to track before picking anything though. Otherwise you'll end up paying for features you never use.
Dude, customer behavior analysis is where the magic happens for segmentation. Look at how people actually use your product instead of just basic demographics. Track which features they love, when they're online, where they bail out - way more useful than knowing someone's age, tbh. Those patterns help you predict what users will do next, so your messaging actually hits. I'd say start small though - pick like 2-3 key behaviors to track first. You'll create segments that make sense instead of random groupings. Then you can send recommendations that don't feel generic and annoying.
Demographic data is your starting point for customer segmentation - age, income, location, education, all that stuff. It helps you figure out who your customers actually are instead of just making assumptions. I mean, you can't really understand buying behavior if you don't know the basics first, right? You'll definitely want to add behavioral and psychographic data later, but demographics give you the foundation. Short sentences work here. Then build on them with the deeper "why" and "how" insights. Just focus on whichever demographic factors actually correlate with your business metrics - that's what'll drive your whole segmentation approach.
Dude, stop sending the same boring emails to everyone - it's not 2010 anymore. Split your customers into groups based on what they actually buy or how they behave. Your big spenders want exclusive stuff, while bargain hunters just care about discounts. Makes total sense when you think about it. The dashboard will show you which groups respond best to different campaigns. Honestly, just pick 2-3 segments to start and test different messages for each. Way better than hoping random content sticks.
Don't cram everything onto one view - I've seen dashboards that look like someone threw up data everywhere and you can't read anything. Skip the vanity metrics that just look pretty but don't help you make actual decisions. Also, build in a refresh system from day one because static dashboards die a slow, forgotten death. Here's the thing though - your segments need to connect to real actions your team can take. Like what's the point of finding "budget shoppers" if marketing can't even target them? Every segment should lead to something you can actually do about it.
Honestly? I'd say every quarter as a starting point, but it really depends on your industry. Fast-moving markets or if you're constantly dropping new products - maybe check monthly. Stable business though? Every 6 months is probably fine. Watch for weird shifts in how people are buying or if your usual customers start acting different - that's when segments get outdated. Oh, and set up some kind of alert system for when performance tanks. Way better than just winging it and hoping you'll notice when things go sideways.
Honestly, advanced analytics is a game changer for finding customer patterns that regular segmentation just can't catch. You're not stuck with basic demographics anymore - instead you can spot behavioral clusters and predict which customers might bail. The cool part is algorithms handle hundreds of data points at once (way more than we could ever process manually). Your segments end up being way more accurate because they're built on what people actually buy and how they engage, not just age or location. I'd start by running your existing segments through some clustering algorithms first and see what pops up. You might be surprised what patterns emerge.
Dude, segmentation dashboards are a game changer for figuring out what to build next. They show you exactly how different customer groups actually behave - like, which features your big spenders love vs what's totally ignored. Way better than just throwing stuff at the wall and hoping it sticks! You'll spot gaps where you're not serving certain segments well, plus see clear patterns in what people actually need. I got a bit obsessed with ours last quarter honestly. Instead of building random features, you can focus on either fixing what's broken for underserved groups or doubling down on what's already crushing it for your best customers.
First thing - get one clean data source everyone uses. Otherwise you'll have marketing saying one thing and sales saying another, which is a nightmare. Clean up duplicates and set up validation checks that run automatically. I made this mistake once and our segments were completely wrong for weeks because of duplicate customer records. Real-time data feeds are pretty much essential now, especially if you're tracking behavior stuff. Document where everything comes from too - sounds boring but you'll thank yourself later. Oh, and test your connections regularly. Set up alerts so you catch problems before they screw up your whole segmentation setup.
So basically, qualitative stuff tells you WHY your numbers look the way they do. Like your dashboard shows Segment A isn't engaging much, but then you talk to customers and find out they're just confused by your interface - not that they hate your product. Numbers don't tell the whole story, you know? I've watched teams totally mess up decisions because they only looked at data without getting the actual context. Customer conversations help you figure out if your segments are real behavioral differences or just random statistical noise. Definitely pair those dashboard reviews with regular customer chats.
So AI segmentation is honestly game-changing - it finds patterns your team would miss in a million years. Way more detailed segments based on behavior, purchase timing, even tiny preference changes. The accuracy is pretty insane. Instead of just describing what people bought before, you get segments that actually predict what customers will do next. Makes your marketing way more targeted. One thing though - and I learned this the hard way - your data has to be clean first. Messy data just gives you messy results, you know? Definitely audit what you've got before jumping into any AI tools.
Oh man, you're so right about this. Different cultures buy stuff completely differently - I learned this the hard way watching a company I worked with bomb in Asia using their US strategy. Japan values group harmony way more than individual perks, you know? So your dashboard definitely needs regional filters. Build separate personas for each market and test weird variables like family dynamics or social hierarchy depending where you're selling. Collectivist cultures want family messaging while individualistic ones care about personal gains. Honestly kind of fascinating how much it varies. Don't just copy-paste segments globally - it's expensive when it backfires.
Netflix and Spotify are the usual suspects everyone mentions. Both use segmentation for recommendations - Netflix for shows, Spotify for playlists. Amazon's crushing it too with their purchase behavior tracking. These companies are basically what everyone else is trying to become. Start simple though - demographic and behavioral stuff first. You can always add the fancy predictive stuff later once you've got the basics down. Oh, and Amazon's recommendation engine is honestly kind of creepy how accurate it gets, but that's the power of good segmentation I guess!
-
Extensive range of templates! Highly impressed with the quality of the designs.
-
Wonderful templates design to use in business meetings.