

Dashboard Snapshot Of Recruitment Funnel And Key Metrics




Try Before you Buy Download Free Sample Product
 Impress Your
 Audience
 100%
100% Editable
 Save Hours
 of Time


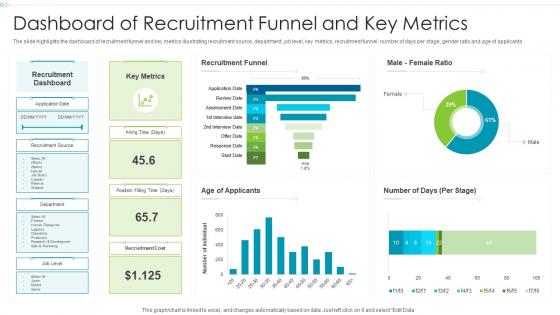
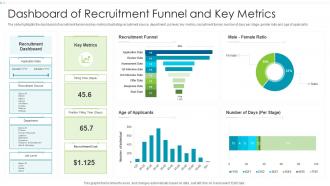
The slide highlights the dashboard snapshot of recruitment funnel and key metrics illustrating recruitment source, department, job level, key metrics, recruitment funnel, number of days per stage, gender ratio and age of applicants.
People who downloaded this PowerPoint presentation also viewed the following :
Dashboard Snapshot Of Recruitment Funnel And Key Metrics with all 7 slides:
Use our Dashboard Snapshot Of Recruitment Funnel And Key Metrics to effectively help you save your valuable time. They are readymade to fit into any presentation structure.





FAQs for Dashboard Snapshot Of Recruitment Funnel
So basically there are five main stages to track: **Sourcing** (finding people), **Application** (when they actually apply), **Screening** (phone calls and initial reviews), **Interview** (the real interview rounds), and **Offer** (making and closing deals). Oh, and most places add **Hire** as a sixth stage - honestly makes way more sense that way. You want to watch your drop-off rates between each step to see where candidates are bailing. That's where the real insights are. I'd check these numbers weekly because once your hiring gets behind, it's a pain to catch up.
So basically, recruitment funnel dashboards show you exactly where your hiring process is breaking down. Like, you might see hundreds of applications but then nobody's passing the phone screen - that's your red flag right there. The cool thing is spotting patterns you'd totally miss otherwise. Which stages drag on forever? Where do people bail out? Plus you can figure out if Indeed is actually bringing better candidates than LinkedIn (spoiler: sometimes the free sites work better). Instead of just throwing darts at the wall, you're making changes based on real data. Track your time-to-hire first, then conversion rates between each step.
Track applications, phone screens, interviews, offers made, and offers accepted. But honestly, the conversion rates matter way more than raw numbers - they show you exactly where people are dropping off. I'd also measure time-to-fill and cost-per-hire for efficiency stuff. Oh, and definitely track where candidates come from so you're not wasting money on crappy job boards. Start with your biggest drop-off points first since that's where you'll see the most improvement. Makes sense to fix the worst problems before tweaking smaller stuff.
So instead of just guessing what's happening in your hiring, the recruitment funnel actually shows you the data. Like where people are dropping out, which steps drag on forever - that kind of stuff. Traditional hiring is honestly such a mess, just tossing resumes around with zero insight. But with the dashboard you can track conversion rates at each stage and catch problems early. I'd probably start with wherever you're losing the most candidates first. Way better than finding out your process is broken after you've already lost good people.
Start with your ATS - Greenhouse or Workday work great. Connect that to Tableau, Power BI, or honestly just Google Data Studio if money's tight. Don't sleep on email tools though! Mailchimp and HubSpot give you solid candidate nurturing data that most people totally ignore. LinkedIn Recruiter feeds are clutch too, plus job board stats from Indeed or ZipRecruiter. The whole point is getting everything into one dashboard. Trust me, you don't want to be clicking through a million tabs just to figure out where people are bailing on your process.
Dude, visualizing your recruiting data is a game changer. Funnel charts show exactly where people drop off - like if 80% ghost you after phone screens, something's wrong there. Heat maps are clutch for seeing which job boards actually work (spoiler: probably not the expensive ones). You'll spot seasonal trends too. Honestly, staring at spreadsheet numbers is torture. But with good visuals? You can fix the broken parts of your process fast. Way better than drowning in data you can't make sense of.
Look, candidate experience is basically what makes or breaks your hiring funnel. If your application process sucks or drags on forever, people will just peace out - especially in those early stages. I've seen it happen so many times. Your dashboard should tell you exactly where candidates are dropping off the most. That's usually where you've got experience problems. Maybe you're taking too long to get back to people, or the application is confusing as hell. Start tracking how many people move from stage to stage and how fast you're responding. Those numbers don't lie.
Go with daily updates - that's the sweet spot for most recruiting dashboards. You'll catch trends and bottlenecks before they bite you. Weekly *might* work if you're hiring super slowly, but honestly? Recruiting moves way too fast for that. Real-time is just showing off unless you're doing crazy high-volume stuff. Match it to how your team actually works. If you're checking metrics every morning or doing weekly pipeline reviews, sync your refresh schedule to that. I'd say start daily and see how it feels - you can always dial it back if your team isn't using the data that much.
Dude, don't cram everything onto one screen - it's tempting but nobody will use it. Also make sure your funnel stages actually match how your team works in real life. Skip the vanity metrics that look cool but won't help you make decisions. Like, you really don't need 15 ways to view application data, that's just noise. Keep your time periods consistent and focus on conversion rates between stages, not just raw numbers. Oh and start with maybe 5-7 key metrics first. You can always add more once people get into the habit of checking it.
Look, your dashboard will show exactly where people are dropping out of your hiring process. Maybe your job posts are trash, or candidates hate your interview setup, or your offer process drags on forever. Track conversion rates at each step - you'll probably find some stages are just brutal (like phone screens that nobody passes). Don't try fixing everything though, that's a mistake I see constantly. Find your biggest problem area first and tackle that. If 80% of people bail after the first interview, start there instead of tweaking minor stuff that won't move the needle.
Each recruiting team obsesses over completely different numbers, so generic dashboards are basically worthless. Tech recruiters want pipeline speed and how many people actually finished their coding tests. Sales recruiting teams? They're all about commission roles and candidate quality. Honestly, it's like giving everyone the same map when some people are hiking and others are driving. When you customize the views, teams can finally spot their real problems and wins. Just ask each team lead what three numbers they check Monday mornings - that's your starting point right there.
So basically you can track diversity numbers at every step to see where you're losing people. The dashboard breaks it down by demographics - maybe you're getting diverse applicants but they bail during phone screens or whatever. Honestly, some of the patterns are pretty wild when you actually see the data laid out. Like certain job boards pull way more diverse candidates, or you'll notice specific interviewers have weird pass rate differences between groups. Once you spot this stuff, tweak your sourcing strategy and definitely review your interview process for bias. Oh and set actual diversity goals for each stage - makes a huge difference.
Ugh, remote hiring is such a pain compared to in-person stuff. Coordinating interviews across time zones? Total nightmare. Your time-to-hire gets way longer because of all the scheduling chaos, plus people flake more or have tech issues that mess everything up. Building that connection through a screen is honestly impossible sometimes - way more candidates drop out in later rounds. The worst part is you can't read people as well virtually, so predicting who'll actually be good gets harder. I'd definitely track your remote metrics separately so you can see how much longer everything takes. At least then you won't be surprised when it drags on forever.
Honestly, ML can be a game-changer for recruitment dashboards. You'll get predictions on which candidates will actually accept your offers, plus it spots bottlenecks before they become disasters. The coolest part? It automatically flags when hiring stages drag on too long or when candidate drop-offs suddenly spike. Historical data helps score candidates too - though don't ditch human judgment obviously. Over time the system learns your company's specific patterns and gets better. I'd start with predictive analytics for time-to-hire first, then move into candidate scoring. Way less guesswork involved.
Honestly, just tell a story with your data instead of dumping numbers on people. Show them where candidates are actually falling off in your funnel - that's what they really want to know. Visual comparisons work way better than spreadsheets (learned this the hard way after watching too many blank stares). Clean dashboards are your friend. Focus on metrics that actually move the needle for business goals. Oh, and this is huge - don't just point out problems. Come with real solutions they can act on right away. Nobody wants to leave a meeting with just more questions.
-
They had the topic I was looking for in a readymade presentation…helped me meet my deadline.
-
SlideTeam, Please don’t stop sharing discount coupons! I love your occasional discounts and tend to buy your products around that corner.