

Auditoría de marketing digital del sitio web y los canales de redes sociales Diapositivas de presentación de Powerpoint





Try Before you Buy Download Free Sample Product
 Impress Your
Audience
 100%
Editable
 Save Hours
of Time


La auditoría digital es la evaluación del rendimiento del sitio web y de todos los canales de redes sociales de las marcas. La auditoría ayuda a identificar áreas de desarrollo que las empresas pueden incorporar para fortalecer su presencia en línea. Obtenga nuestra plantilla de Auditoría de marketing digital de sitios web y canales de redes sociales diseñada profesionalmente que ayudará a todas aquellas empresas que enfrentan problemas relacionados con pocas visitas al sitio web, baja tasa de conversión y alta tasa de rebote. Al principio, este módulo enfatiza la presencia digital organizacional en el que hemos cubierto los objetivos de marketing de la empresa y la evaluación del desempeño de los canales de redes sociales actuales. A continuación, se centra en la necesidad de la auditoría digital, destacando su finalidad. Además, este módulo cubre la estructura, que incluye la categoría de auditoría con el procedimiento adecuado y su cronograma. También analiza las auditorías de redes sociales con hallazgos clave, incluida la tasa de participación, los datos de la audiencia, la información del perfil, etc. Nuestro módulo también le brinda acceso a las auditorías de análisis web, incluida la información de los visitantes y la identificación de métricas de conversión. Este módulo también sugiere algunas áreas de desarrollo para mejorar el rendimiento. Por último, cubre un tablero que destaca a los visitantes del sitio web a través de gráficos de barras y gráficos circulares. Descárgalo ahora.
People who downloaded this PowerPoint presentation also viewed the following :
Contenido de esta presentación de Powerpoint
Diapositiva 1 : esta diapositiva presenta la auditoría de marketing digital del sitio web y los canales de redes sociales. Indique el nombre de su empresa y comience.
Diapositiva 2 : Esta diapositiva indica la agenda de la presentación.
Diapositiva 3 : Esta diapositiva presenta la tabla de contenido de la presentación.
Diapositiva 4 : Esta diapositiva muestra el título de tres temas que se cubrirán a continuación en la plantilla.
Diapositiva 5 : esta diapositiva destaca el perfil de la empresa con los productos y servicios ofrecidos por la empresa.
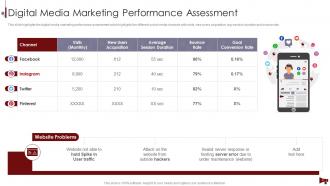
Diapositiva 6 : esta diapositiva destaca la evaluación del desempeño del marketing de medios digitales que destaca los diferentes canales de redes sociales con visitas, etc.
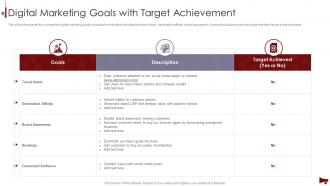
Diapositiva 7 : esta diapositiva muestra los objetivos de marketing digital de las empresas en formato tabular que incluye la intención de viaje, la afinidad del destino, el conocimiento de la marca, etc.
Diapositiva 8 : esta diapositiva muestra el título de tres temas que se cubrirán a continuación en la plantilla.
Diapositiva 9 : esta diapositiva destaca el propósito o el beneficio de la auditoría de marketing digital, que incluye eliminar las brechas de marca, mejorar la fuerza de la campaña, etc.
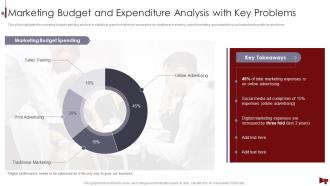
Diapositiva 10 : esta diapositiva destaca el análisis de gastos del presupuesto de marketing en formato de gráfico estadístico que muestra el marketing tradicional clave, el marketing en línea, etc.
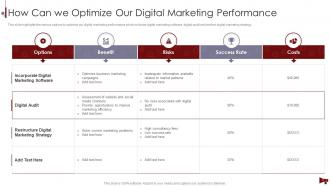
Diapositiva 11 : esta diapositiva destaca las diversas opciones para optimizar nuestro rendimiento de marketing digital, que incluye software de marketing digital, etc.
Diapositiva 12 : esta diapositiva muestra el título de tres temas que se cubrirán a continuación en la plantilla.
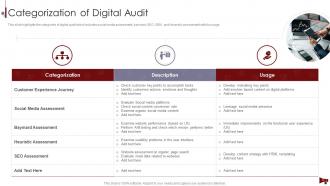
Diapositiva 13 : esta diapositiva destaca las categorías de auditoría digital que incluyen evaluación de redes sociales, baymard, SEO, SEM y evaluación heurística con su uso.
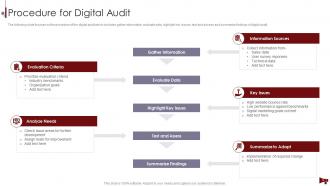
Diapositiva 14 : esta diapositiva se enfoca en el procedimiento de la auditoría digital que incluye recopilar información, evaluar datos, resaltar problemas clave, probar.
Diapositiva 15 : esta diapositiva destaca la lista de verificación de auditoría digital que incluye auditoría de sitio web, SEO, auditoría de marketing en redes sociales, página de destino, auditoría de consistencia de marca.
Diapositiva 16 : Esta diapositiva muestra el título de cinco temas que se cubrirán a continuación en la plantilla.
Diapositiva 17 : Esta diapositiva muestra el título de Auditoría del sitio web.
Diapositiva 18 : Esta diapositiva muestra la descripción general de la auditoría del sitio web, que incluye la auditoría del SEO del sitio web, la auditoría del contenido del sitio web y la auditoría de la tasa de conversión del sitio web.
Diapositiva 19 : esta diapositiva destaca los hallazgos de la auditoría de contenido, que incluyen métricas de participación de diferentes publicaciones, calidad del contenido y valor SEO del contenido.
Diapositiva 20 : esta diapositiva destaca la tasa de conversación del sitio web de acuerdo con el tipo de página, la vista de página, la tasa de conversión y la duración promedio de la sesión.
Diapositiva 21 : esta diapositiva destaca la auditoría de SEO que muestra la puntuación de la página, los errores críticos, las advertencias, los resultados de las páginas rastreadas, el estado del sitio, etc.
Diapositiva 22 : esta diapositiva destaca los hallazgos de la auditoría del sitio web, que incluye el análisis detallado de la auditoría SEO del sitio web y la auditoría del contenido del sitio web.
Diapositiva 23 : Esta diapositiva muestra el título de Auditoría de redes sociales.
Diapositiva 24 : esta diapositiva destaca la lista de verificación de auditoría de redes sociales que incluye diferentes elementos que muestran datos de audiencia, información de perfil, tasa de participación, etc.
Diapositiva 25 : Esta diapositiva destaca el informe de auditoría de desempeño de las redes sociales que incluye el tamaño y la tasa de crecimiento de Facebook, Instagram, Twitter y YouTube.
Diapositiva 26 : esta diapositiva destaca la auditoría de redes sociales que muestra el grado de rendimiento de la presencia en Facebook, Instagram, Twitter y YouTube.
Diapositiva 27 : esta diapositiva muestra el título de la auditoría técnica.
Diapositiva 28 : esta diapositiva destaca la descripción general detallada de la auditoría técnica que se centra en la auditoría de rendimiento del sitio web con prueba de velocidad y auditoría de diseño web receptivo.
Diapositiva 29 : esta diapositiva muestra la auditoría de rendimiento del sitio web que establece el diagnóstico de la puntuación de rendimiento del sitio web, los segundos cargados del sitio web, el primer byte con la API.
Diapositiva 30 : esta diapositiva destaca la auditoría de diseño web receptivo que incluye diseños flexibles, imágenes y videos, consultas de medios.
Diapositiva 31 : esta diapositiva destaca la auditoría técnica del sitio web que incluye elementos de la página con los problemas clave asociados con los elementos de la página y la puntuación de revisión.
Diapositiva 32 : Esta diapositiva muestra el título de Auditoría de alineación de ventas y marketing.
Diapositiva 33 : Esta diapositiva destaca la auditoría de alineación de ventas y marketing que también incluye el problema y la sugerencia que se enfoca en el comprador objetivo, etc.
Diapositiva 34 : esta diapositiva destaca los hallazgos de la auditoría de alineación de ventas y marketing, que incluye objetivos de clientes similares, información de demostración de productos, etc.
Diapositiva 35 : esta diapositiva muestra el título de la auditoría de análisis web.
Diapositiva 36 : esta diapositiva destaca la planificación de la auditoría de análisis web, que incluye los ajustes de configuración, la información de los visitantes y las métricas de conversión.
Diapositiva 37 : esta diapositiva destaca el informe de auditoría de análisis web con la tasa de conversación del sitio web, el tipo de visitantes del sitio web, la tasa de apertura del sitio web del tráfico del sitio.
Diapositiva 38 : esta diapositiva destaca los hallazgos clave para la auditoría de análisis web, que incluye el puntaje de la tasa de conversación, la compra por tipo de dispositivo, etc.
Diapositiva 39 : esta diapositiva destaca la descripción general de todas las secciones de la auditoría de marketing digital que se centra en la auditoría del sitio web, la auditoría de las redes sociales, la auditoría técnica, etc.
Diapositiva 40 : esta diapositiva muestra el título del tema que se cubrirá a continuación en la plantilla.
Diapositiva 41 : esta diapositiva destaca la estimación de costos de la auditoría digital, que incluye la auditoría del sitio web, la auditoría de las redes sociales, la auditoría técnica, las ventas, etc.
Diapositiva 42 : Esta diapositiva muestra el título del tema que se cubrirá a continuación en la plantilla.
Diapositiva 43 : esta diapositiva destaca las herramientas para la auditoría digital en formato tabular que muestra múltiples herramientas para la auditoría de marketing digital con su uso.
Diapositiva 44 : Esta diapositiva muestra el título de tres temas que se cubrirán a continuación en la plantilla.
Diapositiva 45 : esta diapositiva destaca las sugerencias de mejora de la evaluación de auditoría digital que muestran la reestructuración de la búsqueda paga, etc.
Diapositiva 46 : Esta diapositiva muestra el desarrollo de infraestructura y aplicaciones para una mejor conciencia digital que incluye alojamiento, velocidad del sitio web, etc.
Diapositiva 47 : Esta diapositiva muestra la promoción digital como un método destacado de marketing que involucra marketing de búsqueda, marketing multicanal, móvil y por correo electrónico.
Diapositiva 48 : esta diapositiva muestra el título del tema que se cubrirá a continuación en la plantilla.
Diapositiva 49 : esta diapositiva muestra el gasto digital con los ingresos de la organización y los ahorros totales de la organización con el gasto digital adecuado en marketing.
Diapositiva 50 : esta diapositiva muestra el título de dos temas que se cubrirán a continuación en la plantilla.
Diapositiva 51 : esta diapositiva destaca los visitantes del sitio web por diferentes países, que también incluye los usuarios y los datos de sesión de los últimos 10 días, etc.
Diapositiva 52 : Esta diapositiva muestra el panel de control de la auditoría digital del sitio web que incluye visitantes, clientes potenciales, clientes, MRR, valor de por vida, etc.
Diapositiva 53 : esta diapositiva muestra iconos para la auditoría de marketing digital del sitio web y los canales de redes sociales.
Diapositiva 54 : Esta diapositiva se titula Diapositivas adicionales para avanzar.
Diapositiva 55 : Esta diapositiva destaca la auditoría de seguridad que muestra los riesgos relacionados con las cuentas.
Diapositiva 56 : Esta diapositiva representa un gráfico de columnas apiladas con una comparación de dos productos.
Diapositiva 57 : Esta diapositiva muestra un gráfico de áreas con una comparación de dos productos.
Diapositiva 58 : Esta diapositiva muestra el diagrama de Venn con cuadros de texto.
Diapositiva 59 : Esta diapositiva muestra Post-It Notes. Publique sus notas importantes aquí.
Diapositiva 60 : Esta diapositiva contiene Rompecabezas con íconos y texto relacionados.
Diapositiva 61 : Esta es la diapositiva Nuestro objetivo. Indique sus objetivos aquí.
Diapositiva 62 : esta diapositiva muestra una lupa para resaltar información, especificaciones, etc.
Diapositiva 63 : Esta es una diapositiva de agradecimiento con dirección, números de contacto y dirección de correo electrónico.
Auditoría de marketing digital del sitio web y canales de redes sociales Diapositivas de presentación de Powerpoint con las 68 diapositivas:
Utilice nuestra Auditoría de marketing digital del sitio web y los canales de redes sociales Diapositivas de presentación de Powerpoint para ayudarlo de manera efectiva a ahorrar su valioso tiempo. Están listos para encajar en cualquier estructura de presentación.
-

Digital Marketing Audit of Website and Social Media Channels
-

Digital Marketing Audit of Website and Social Media Channels
-

Digital Marketing Audit of Website and Social Media Channels
-
Current Scenario of our Digital Marketing Strategy
-

Company Business Profile with Key Services
-
Digital Media Marketing Performance Assessment
-
Digital Marketing Goals with Target Achievement
-
Need of Digital Audit
-

Purpose of Digital Audit
-
Marketing Budget and Expenditure Analysis with Key Problems
-
How Can we Optimize Our Digital Marketing Performance
-

Prepare Structure and Conduct Digital Audit
-
Categorization of Digital Audit
-
Procedure for Digital Audit
-
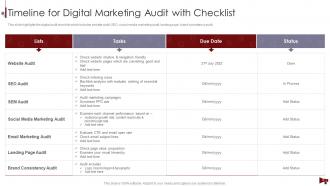
Timeline for Digital Marketing Audit with Checklist
-
Implement Digital Audit and Key Findings
-

Website Audit
-
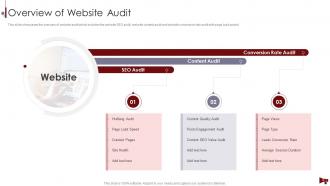
Overview of Website Audit
-
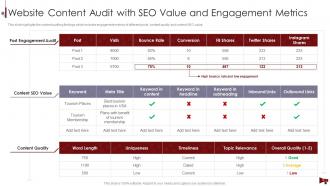
Website Content Audit with SEO Value and Engagement Metrics
-
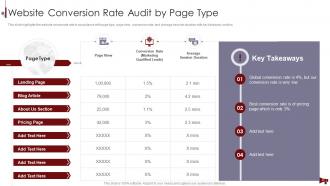
Website Conversion Rate Audit by Page Type
-
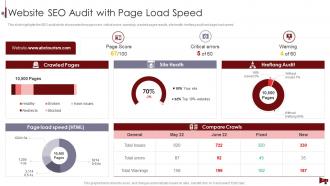
Website SEO Audit with Page Load Speed
-
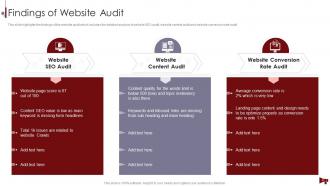
Findings of Website Audit
-

Social Media Audit
-
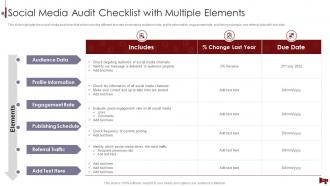
Social Media Audit Checklist with Multiple Elements
-
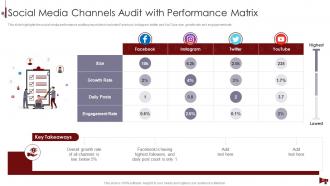
Social Media Channels Audit with Performance Matrix
-
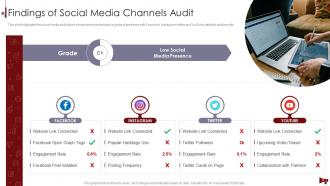
Findings of Social Media Channels Audit
-

Technical Audit
-

Overview of Technical Audit
-
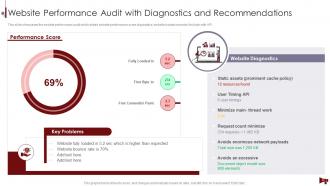
Website Performance Audit with Diagnostics and Recommendations
-
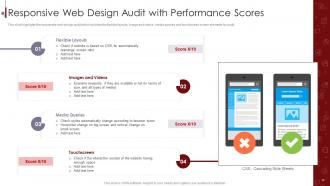
Responsive Web Design Audit with Performance Scores
-
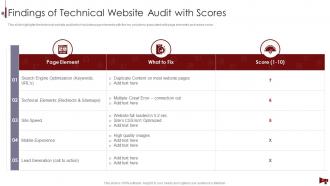
Findings of Technical Website Audit with Scores
-

Sales and Marketing Alignment Audit
-
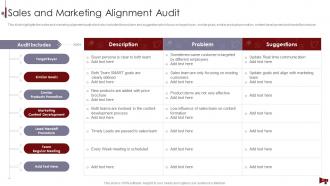
Sales and Marketing Alignment Audit
-
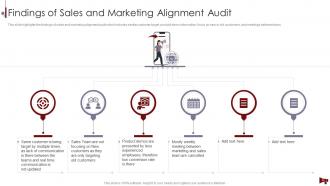
Findings of Sales and Marketing Alignment Audit
-

Web Analytics Audit
-
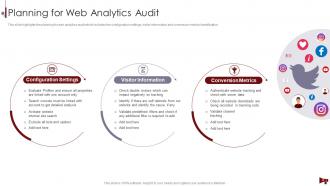
Planning for Web Analytics Audit
-
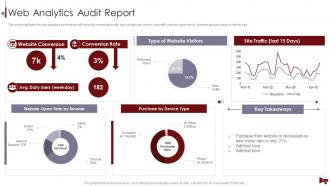
Web Analytics Audit Report
-
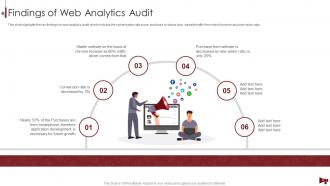
Findings of Web Analytics Audit
-
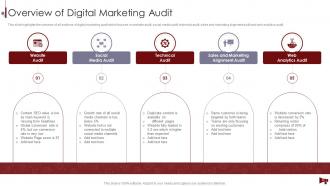
Overview of Digital Marketing Audit
-
Cost Estimation of Digital Marketing Audit
-
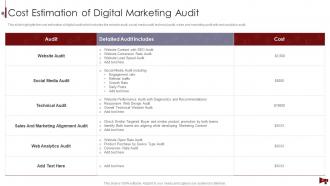
Cost Estimation of Digital Marketing Audit
-

Tools for Digital Marketing Audit
-
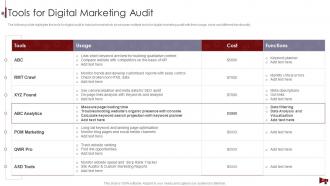
Tools for Digital Marketing Audit
-

Recommended Suggestions and Areas of Development
-
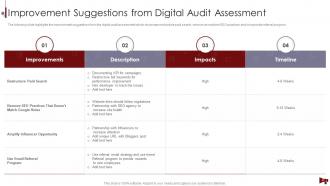
Improvement Suggestions from Digital Audit Assessment
-
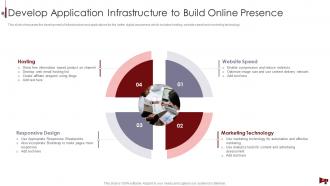
Develop Application Infrastructure to Build Online Presence
-
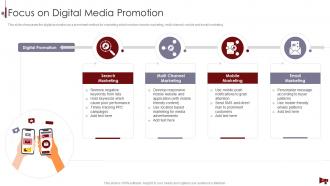
Focus on Digital Media Promotion
-

Digital Spending and Projections of Financial Incentives
-
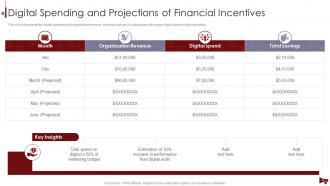
Digital Spending and Projections of Financial Incentives
-

Digital Audit Dashboards
-
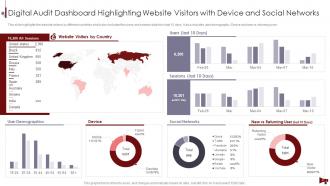
Digital Audit Dashboard Highlighting Website Visitors with Device and Social Networks
-
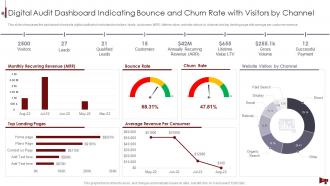
Digital Audit Dashboard Indicating Bounce and Churn Rate with Visitors by Channel
-

Icons Slide for Digital Marketing Audit of Website and Social Media Channels
-

Additional Slides
-
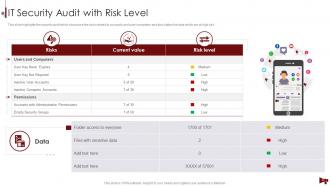
IT Security Audit with Risk Level
-
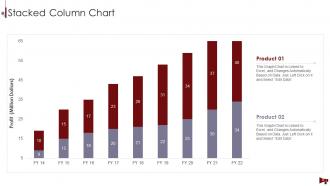
Stacked Column Chart
-
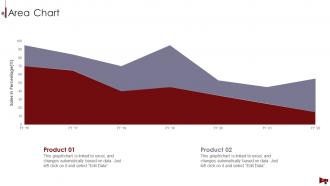
Area Chart
-
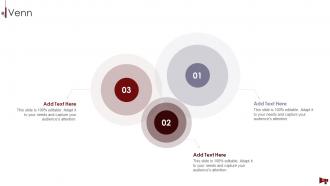
Digital Marketing Audit of Website and Social Media Channels
-
Post It Notes
-
Puzzle
-

Our Target
-
Magnifying Glass
-

Thanks for Watching
-

-

-

-

-

FAQs for Digital Marketing Audit Of Website And Social Media Channels
Honestly, start with your website traffic and where it's coming from - that's your foundation. Then look at conversion rates across everything, email open/click rates, and how your social posts are performing. SEO rankings for your main keywords matter too, obviously. Cost per acquisition is huge for paid stuff, and ROI by channel is what your boss actually cares about anyway. Oh, and don't skip bounce rates or page speed - those mess with everything else if they're bad. The real trick is comparing this month to last month and to your targets. That's how you spot what's crushing it versus what's just burning cash for no reason.
Check Google Analytics first to see your organic traffic trends. Then hit up Search Console - that's where you'll find what keywords you're actually ranking for (versus what you think you are). The gaps are always wild! Look at click-through rates and average position. Also check for crawl errors messing with your visibility. Site speed and mobile stuff matters too, plus make sure your pages are even getting indexed. Oh, and peek at what keywords your competitors are crushing that you're missing. Start there and the big wins will jump out pretty quick.
Look, social media analysis is like getting a reality check on whether your brand actually connects with people. I'm always digging into engagement rates and follower growth first. Then the real stuff - traffic and conversions from each platform. Honestly, audience insights are where I get a little nerdy because they tell you everything. You're basically figuring out if your content strategy matches where your people actually spend time. Some platforms will surprise you with results while others are just... pretty numbers that don't mean much. Focus on what's driving real business, not vanity metrics.
Honestly, you've gotta track two things - how people interact with your stuff AND whether it actually makes you money. So look at time on page, shares, comments, click-through rates... basically are people consuming it? Then - and this is where most people mess up - connect that to actual leads and sales. I mean, getting a million views is cool but doesn't matter if nobody buys anything, right? Don't forget SEO either. Check if you're ranking for keywords you care about. Just make sure you can actually trace which content pieces lead to real business results.
Start with Google Analytics and Search Console - they're free and give you the basics. Screaming Frog is amazing for catching technical stuff like broken links (seriously, it's saved me countless times). For keyword research, SEMrush or Ahrefs are worth the money. GTMetrix handles speed testing, and I actually like Hotjar for seeing how people move around your site. Social media wise, just use the native analytics - Instagram Insights, Twitter Analytics, whatever. Hootsuite works too if you're managing multiple accounts. Honestly though, master the Google tools first before you start throwing money at fancy dashboards.
Honestly, UX is everything when you're doing a digital marketing audit. Bad user experience shows up everywhere - your bounce rates tank, conversions suck, engagement is terrible. I always tell people it's like having a leaky bucket. You could have amazing ads and perfect SEO, but if people can't actually use your site? Your whole audit will show campaigns failing left and right. Map out the user journey first - trust me on this one. It makes reading all those other metrics so much easier. Plus you'll actually understand why things aren't working instead of just seeing bad numbers.
So for your email audit, start with the obvious stuff - open rates, click-through rates, conversions, and unsubscribes. Bounce rates are huge too because if you're hitting spam folders, you're basically screaming into the void. Track how fast your list is growing and whether your segmentation actually works. Revenue per email matters if you're selling stuff online. Oh, and definitely check mobile stats since literally everyone reads email on their phones now. Honestly, I'd pull 90 days of data instead of just looking at one campaign - trends tell you way more than random snapshots.
Check your ROAS and cost per acquisition first - those actually matter for your bottom line. CTR and quality scores are nice but honestly kinda useless if they're not driving sales. Pull reports from the last 3-6 months and compare how Google Ads performs against Facebook or whatever else you're running. Attribution data will show you which campaigns really work, not just the ones getting credit for last-click conversions. Oh, and conversion rates across platforms too. Start by finding your best and worst campaigns - makes it way easier to figure out where to put your money.
Honestly, competitor analysis is like peeking over the fence to see what your neighbors are up to. Check which keywords they're crushing that you're completely missing. Look at their content - what's getting engagement? How do they show up on social? You'll probably find some glaring weaknesses too, like terrible site navigation or content that's just... meh. I always get distracted looking at their design choices too. Anyway, compare your stuff to theirs and pick 2-3 areas where you can actually beat them. It's basically free intel.
Go for the quick wins first - broken tracking, high-traffic pages with obvious problems. That stuff shows results fast. Then hit the medium-effort things that actually matter to your business right now. Don't try fixing everything at once (trust me, I learned this the hard way). Pick 3-5 things max each quarter. Focus on what's hurting revenue, not just what looks ugly. Make a simple spreadsheet ranking effort vs impact. Work down that list. The messy stuff that doesn't affect sales? Yeah, that can wait.
Don't try auditing everything at once - you'll drown in data and miss the good stuff. Pick your biggest channel first and work through it completely. I learned this the hard way lol. Also, stop getting distracted by fancy metrics that don't actually matter to your bottom line. Connect everything back to real goals. Talk to other teams too! Sales and customer service usually know things about what's working that you'd never guess from looking at dashboards. Work systematically through each channel instead of bouncing around randomly. Trust me, it's way less overwhelming.
Honestly? Twice a year minimum, but quarterly if you can swing it. I used to think annual audits were fine until I realized how much stuff changes in just a few months - algorithms, competitor moves, your own campaigns shifting around. After big launches or budget changes, definitely do a quick check too. The trick isn't waiting until things are obviously broken. Even if you're swamped, maybe just tackle one channel each month? That's way better than ignoring it completely. Oh and actually put it in your calendar right now or you'll totally forget!
So customer feedback is like your wake-up call during a marketing audit - shows what's really happening vs what you think is happening. Pull reviews, surveys, social comments, support tickets from the past 3-6 months. Look for where people are getting stuck or pissed off in your funnel. I swear, half the time you'll find out your "brilliant" email campaign is actually driving people nuts. That's the whole point though! Their honest reactions show you which channels are broken and need fixing first. Way better than guessing what's wrong.
Oh man, GDPR and CCPA will definitely mess with your audit results. Your tracking probably grabs way more personal data than you're legally allowed to without consent - happens all the time. Cookie consent issues will pop up for sure, plus those third-party tools you're using might not be compliant. Data retention policies are another headache since most companies just keep everything forever. Cross-border transfers get messy too. I learned this the hard way with a client last year. Don't brush off these privacy findings because the fines are absolutely brutal.
Okay so first thing - you've gotta update how you're tracking people since cookies are basically dying. Privacy-first stuff is huge now. AI personalization and voice search optimization should definitely be on your radar too. Honestly? Static content looks so outdated at this point. Video and interactive experiences are pretty much expected now. Check where your audience might be moving to new platforms, and see what you can automate to make your life easier. Don't just audit what's working - look for gaps where these trends could fit. Which ones actually match how your customers behave though?
-
Great product with effective design. Helped a lot in our corporate presentations. Easy to edit and stunning visuals.
-
Editable, diversified, compatible with MS PPT and Google Slides, and on top of that finest graphics!! I mean in the words of the famous Ross Geller, “What more do you want!”