

Economic forecasting powerpoint presentation slides




Try Before you Buy Download Free Sample Product
 Impress Your
 Audience
 100%
100% Editable
 Save Hours
 of Time


Showcase future monetary predictions of an upcoming project more efficient by using our Economic Forecasting PowerPoint Presentation Slides. With the aid of this content ready financial forecast PPT theme, you can explain how to project the inflow of money in your organization. You can highlight the ways that minimize the overall cost of the products with the help of the revenue planning PowerPoint graphic. Use the cash flow forecasting presentation template and display the factors that improve the organizational performance related to the revenue of the product. Take the assistance of this professionally designed financial projection and determine the exact condition of the monetary value of your company. Employ the forecast period PPT deck and discuss the stages like expansion, peak, contraction, and through of the economic lifecycle. Use the market forecasting presentation slides and portray upcoming demand for products. Therefore, download our ready-to-use financial planning PowerPoint deck and emphasize on the performance metrics of your business.
People who downloaded this PowerPoint presentation also viewed the following :
Content of this Powerpoint Presentation
Slide 1: This slide introduces Economic Forecasting. State Your Company Name and begin.
Slide 2: This slide shows Presentation Outline.
Slide 3: This is Market Assessment Agenda Slide describing- Market Landscape, Recommendation, Market Sizing.
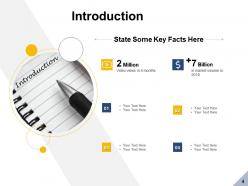
Slide 4: This is an Introduction slide with related imagery.
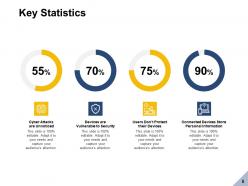
Slide 5: This slide presents Key Statistics as- Devices Are Vulnerable to Security, Users Don’t Protect their Devices, Connected Devices Store Personal Information, Cyber Attacks are Unnoticed.
Slide 6: This is a Market Survey Template with related icons and text boxes.
Slide 7: This slide displays Market Survey with Graphical Representation.
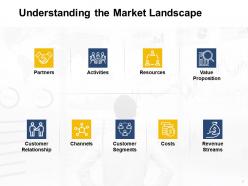
Slide 8: This slide represents Understanding the Market Landscape describing- Customer Segments, Partners, Resources, Channels, Activities, Customer Relationship, Value Proposition, Costs, Revenue Streams.
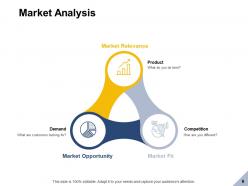
Slide 9: This slide showcases Market Analysis describing- Market Opportunity, Market Relevance, Market Fit.
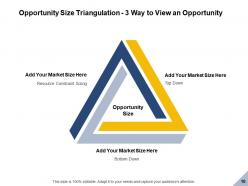
Slide 10: This slide shows Opportunity Size Triangulation – 3 Way to View an Opportunity.
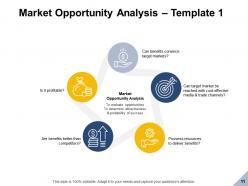
Slide 11: This slide presents Market Opportunity Analysis – Template 1.
Slide 12: This slide displays Market Opportunity Analysis – Template 2.
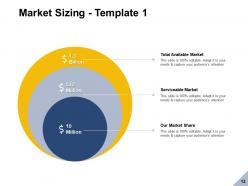
Slide 13: This slide represents Market Sizing – Template 1 describing- Total Available Market, Serviceable Market, Our Market Share.
Slide 14: This slide showcases Market Sizing – Template 2.
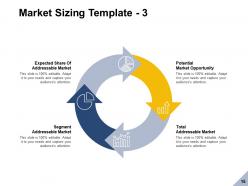
Slide 15: This slide shows Market Sizing – Template 3 describing- Expected Share Of Addressable Market, Segment Addressable Market, Total Addressable Market, Potential Market Opportunity.
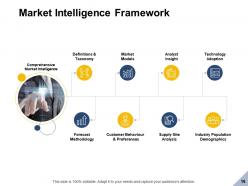
Slide 16: This slide presents Market Intelligence Framework describing- Definitions & Taxonomy, Market Models, Analyst Insight, Technology Adoption, Forecast Methodology, Customer Behaviour & Preferences, Supply-site Analysis, Industry Population Demographics.
Slide 17: This slide displays Product Opportunity Evaluation describing- Customer, Product, Finance, Timing, Competition.
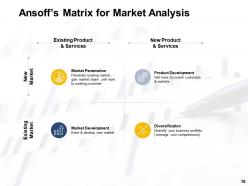
Slide 18: This slide represents Ansoff’s Matrix for Market Analysis.
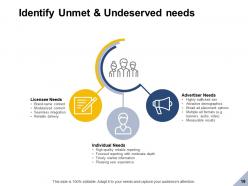
Slide 19: This slide showcases Identify Unmet & Undeserved Needs describing- Advertiser Needs, Licensee Needs, Individual Needs.
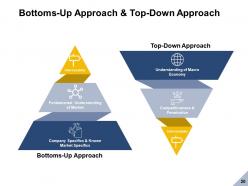
Slide 20: This slide shows Bottoms-Up Approach & Top- Down Approach with related diagram.
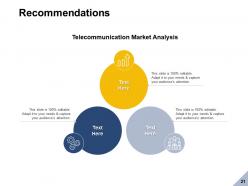
Slide 21: This is a Recommendations slide with related icons.
Slide 22: This slide reminds about a 15 minutes Coffee break.
Slide 23: This slide displays Economic Forecasting Icons.
Slide 24: This slide is titled as Additional Slides for moving forward.
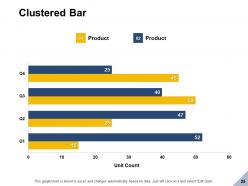
Slide 25: This slide shows Clustered Bar chart with products comparison.
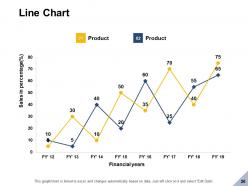
Slide 26: This slide presents Line Chart with two products comparison.
Slide 27: This is Our Team slide with names and designation.
Slide 28: This is About Us slide to show company specifications etc.
Slide 29: This is a Quotes slide to convey message, beliefs etc.
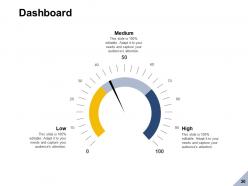
Slide 30: This is a Dashboard slide with text boxes.
Slide 31: This is a Venn slide with text boxes to show information.
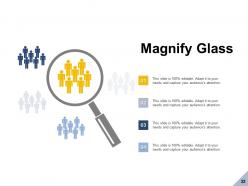
Slide 32: This slide shows Magnify Glass to highlight information.
Slide 33: This is a Thank you slide with address, contact numbers and email address.
Economic forecasting powerpoint presentation slides with all 33 slides:
Use our Economic Forecasting Powerpoint Presentation Slides to effectively help you save your valuable time. They are readymade to fit into any presentation structure.









FAQs for Economic forecasting
So GDP growth and unemployment are your basics - gotta start there. Employment data's honestly the most telling since it drives how much people actually spend. Stock market and housing starts can predict what's coming, though markets go crazy sometimes for no reason lol. Interest rates matter too because they affect whether businesses want to borrow money. You can't just pick one thing though - I'd track maybe 3-4 indicators that actually relate to your field. Consumer spending tells you a lot. The whole trick is looking at them together instead of getting obsessed with single numbers.
So basically, quantitative uses hard numbers and stats to predict economic stuff. Qualitative is more about expert opinions and surveys - the touchy-feely data that's harder to measure. Go quantitative when you've got good historical data, like for GDP or inflation forecasting. But during crazy uncertain times? That's when qualitative shines since your models might totally miss what's actually happening. Remember 2008? All those fancy models completely whiffed on predicting that mess. The smartest forecasters don't pick sides though. They'll run their statistical models first, then tweak the results based on what they're sensing about market vibes or upcoming policy changes.
Yeah, geopolitical stuff will totally mess up your economic forecasts. Brexit, trade wars, random conflicts hitting oil supply - this stuff happens fast and your models can't really predict it. Instead of trying to nail one perfect forecast, build a few different scenarios with various assumptions. Watch for early signs like diplomatic tensions getting heated. But honestly, some events are just impossible to see coming. The trick is staying flexible. Update everything when new political drama unfolds - and trust me, there's always something brewing somewhere that could shake things up.
Dude, ML is seriously changing how we predict economic stuff. These algorithms can crunch through insane amounts of data - like satellite images showing factory activity or Twitter sentiment - way faster than any human could. What's cool is they catch weird patterns traditional models totally miss. They handle all those messy, non-linear relationships too. When markets go crazy, they adapt quick instead of just breaking. I mean, you can feed them hundreds of variables at once. Start small though - try mixing ML predictions with whatever models you're already using. Works way better than going all-in immediately.
Honestly, treat forecasts like a general direction rather than gospel - economists are wrong half the time anyway. Don't put all your eggs in one basket; check multiple sources and focus on the overall trends, not exact numbers. Recession vibes? Maybe hold off on that big expansion and stockpile some cash instead. Growth looking likely? Could be time to jump into new markets or beef up capacity. The smart move is planning for different scenarios so you're not totally screwed when things change. Oh, and always leave yourself some wiggle room - rigid plans break fast.
Honestly, those old models just can't keep up anymore. They're based on historical patterns, but nothing about the last few years has been "historical" - supply chains are still a mess, Twitter can tank a stock overnight, and governments keep throwing curveballs. The models assume people act rationally too, which... yeah, good luck with that lately. They're also way too slow processing real-time data. My advice? Don't ditch them completely, but definitely mix in some alternative data sources and do scenario planning. Oh, and maybe have a backup plan for when geopolitics decides to blow everything up again.
So consumer confidence is basically how optimistic people feel about spending money. It matters because consumer spending drives most of our economy - like 70% of it. High confidence means people buy more, GDP goes up, jobs get created. When it drops? Recession usually hits within 6-12 months. Stock market swings, job growth, wages, and even political chaos all mess with these numbers. I check them monthly since they're early warning signals - way better than waiting for employment data to catch up. Honestly, it's one of the few economic indicators that actually predicts stuff before it happens.
Historical data matters a ton for economic forecasting - it shows you patterns and cycles you'd miss otherwise. Honestly, the best approach is mixing traditional time series stuff with machine learning that can crunch huge datasets. But here's the thing: you can't just blindly trust old data because economies shift over time. What worked in the 1990s might be totally irrelevant now. I'd go with ensemble methods that combine different approaches. Oh, and definitely test your models on data they haven't seen before. Clean your dataset first though - garbage in, garbage out and all that.
Yeah so policy changes totally mess with your forecasting models. Historical data becomes way less useful when the Fed switches rates or Congress changes spending patterns. You'll have to rethink consumer behavior assumptions, business investment trends, inflation expectations - the whole thing basically. Running multiple scenarios helps deal with the uncertainty, which honestly gets exhausting after a while. Smart move is designing flexible models upfront. That way you can just tweak parameters when policies shift instead of rebuilding everything from zero.
Dude, the data is just terrible in developing countries - incomplete stats, tons of informal economy stuff that never gets recorded. Their economies swing around like crazy too. Commodity prices tank? Capital flees? They're screwed. Political chaos doesn't help either, which honestly makes developed markets look boring by comparison. It's basically like forecasting with broken equipment. I'd say grab data from multiple sources and watch leading indicators instead of trusting official numbers. Way more reliable that way.
Seasonal patterns will totally throw off your forecasts if you ignore them - like Black Friday sales or summer construction that happen every year. X-13ARIMA-SEATS works great for smoothing out those predictable swings, though honestly the Census Bureau's basic moving averages might be easier to start with. Strip out the seasonal noise first. Then you can actually see what's trending versus just normal yearly cycles. Oh, and definitely write down which method you picked - I learned that one the hard way when my boss asked me to explain my numbers six months later and I'd completely forgotten my process.
Look, you really can't ignore international trade when forecasting anymore. Global economies are so tangled up that when China tweaks manufacturing or the US changes interest rates, everyone feels it. Currency swings, supply chain mess-ups, trade wars - this stuff ripples everywhere way faster than you'd think. Honestly, domestic-only models are pretty useless now. I learned this the hard way watching Brexit forecasts go sideways. Your predictions will be garbage if you don't account for major trading partners. The whole world's connected whether we like it or not.
Make your data tell a story that matches who you're talking to. Visual dashboards work great - just highlight the important stuff. Always show confidence intervals though, because honestly, I've watched too many "predictions" get treated like facts when they're really just smart guesses. Skip the single number forecasts. Instead, build out different scenarios so people see the range of what could happen. Oh, and explain your method upfront - stakeholders need to know how you got there. Don't forget external factors that might throw everything off. Regular review meetings help too since people can actually challenge your assumptions face-to-face.
Dude, just be super upfront about how uncertain your forecasts actually are. Don't oversell how precise they'll be - I've watched so many people get totally wrecked doing that. Give them ranges, not just your best guess. And honestly? Always mention your assumptions and where you might be wrong, especially if big decisions are riding on this. People will act on whatever you tell them, so include the scary scenarios too. Oh, and remind them forecasts are planning tools, not some crystal ball situation. A little humility goes a long way here.
Honestly, COVID completely wrecked how we predict economic stuff. Traditional models just... died. Employment numbers, spending habits, supply chains - everything went crazy when countries locked down like that. Models that worked for decades? Useless overnight. Pretty embarrassing for economists everywhere, not gonna lie. Now everyone's doing way more "what if" planning. Most forecasters treat pandemic-level disruptions as normal possibilities instead of freak accidents. My advice? Build in tons of flexibility and wider uncertainty ranges in whatever you're forecasting. Oh, and maybe keep a backup plan for when your main model inevitably breaks again.
-
Easily Understandable slides.
-
It saves your time and decrease your efforts in half.
-
Awesome presentation, really professional and easy to edit.
-
Top Quality presentations that are easily editable.
-
Great quality product.