

Finance Accounting Flowchart Powerpoint Ppt Template Bundles




Try Before you Buy Download Free Sample Product
 Impress Your
 Audience
 100%
100% Editable
 Save Hours
 of Time


Our Finance Accounting Flowchart Powerpoint Ppt Template Bundles are topically designed to provide an attractive backdrop to any subject. Use them to look like a presentation pro.
People who downloaded this PowerPoint presentation also viewed the following :
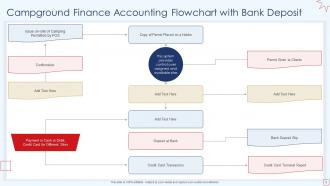
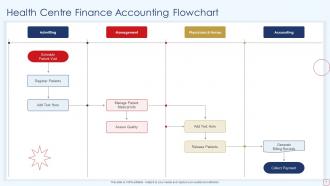
Finance Accounting Flowchart Powerpoint Ppt Template Bundles with all 17 slides:
Use our Finance Accounting Flowchart Powerpoint Ppt Template Bundles to effectively help you save your valuable time. They are readymade to fit into any presentation structure.










FAQs for Finance Accounting Flowchart Powerpoint
So basically you've got your data inputs - invoices, receipts, bank statements, all that stuff. Then there's the processing part where you do journal entries and post everything to ledgers. Decision points are where approvals happen (honestly the most annoying part imo). Finally you get your outputs like financial statements and reports. It's kinda like following a recipe where each step builds on the last one. The whole thing just tracks how your financial data flows from messy transactions to clean final reports. I'd probably start with your month-end close process since it hits most of these components.
Dude, you should totally make a finance flowchart. It standardizes everything so your team isn't winging it differently each time. Think of it like directions for your accounting stuff - everyone follows the same steps from data entry through final reports. No more random month-end disasters. The visual part makes it obvious where things usually go wrong, so you can add extra checks there. I know it sounds boring to set up, but seriously - map out your main processes and you'll catch way fewer mistakes. Your future self will thank you when closing the books actually goes smoothly for once.
Honestly, I'd go with **Lucidchart** or **Visio** for finance flowcharts. Lucidchart's cloud-based so your whole team can edit in real-time - saves tons of headaches with version control. Visio's great if you're already using Microsoft stuff everywhere. **Draw.io** is solid too and it's free, which is nice. All of them have accounting templates and the right symbols you'll need. The real-time collaboration thing with Lucidchart is actually pretty clutch though. I'd probably start with their free version and see how it goes before paying for anything.
So basically, a finance accounting flowchart maps out how money moves through your company step by step. You can see the whole journey - from recording transactions to churning out final reports. It shows which departments handle what, where approvals happen, and honestly, where things tend to get stuck (there's always that one bottleneck, right?). Decision points and storage areas are marked clearly. Starts with transaction recording, goes through processing and reconciliation, ends with financial statements. Pretty useful for catching inefficiencies and making sure nothing gets lost in the shuffle.
Honestly, the worst thing you can do is overcomplicate it with a million decision points - people's eyes will glaze over immediately. Map what actually happens, not what your policy manual pretends happens (trust me on this one). Don't forget approval steps or who owns each task either. Get your key people involved early because they'll spot stuff you totally missed. I see so many flowcharts that look amazing but are completely useless in practice. Keep it simple at first, test with your team, then add layers if you really need them. Short beats pretty every time.
Honestly, flowcharts are game-changers for getting your finance team on the same page. No more endless email chains trying to explain month-end close steps. Everyone can literally see the process - who does what, where things go, all those decision points that usually cause chaos. New hires love them too since they don't have to decode some ancient procedure manual (we've all been there). The visual aspect just clicks better than walls of text. Pick whatever process makes everyone want to pull their hair out and map it together. You'll be shocked how much clearer things become once it's all laid out visually.
Rectangles are your go-to for processes like "record transaction." Diamonds show decision points - think "is amount over $5000?" Start and stop points get ovals. Arrows show flow direction, obviously. When things get messy (and trust me, they will), circles work as connectors to keep your chart readable. Use parallelograms for inputs and outputs like reports. Honestly, the main thing is staying consistent throughout so people can actually follow your logic. Oh, and if you're showing this to anyone outside accounting, definitely add a legend. They'll thank you later.
Add diamond shapes for your compliance checkpoints - SOX controls, regulatory stuff, audit requirements. I put mine right before the big steps like journal entries or payments. Color-code them differently so they pop during reviews (trust me on this one). Each diamond needs clear yes/no paths. Compliance fails? Route it to remediation first. Don't just randomly scatter these everywhere though. Map your critical compliance moments first, then build everything else around those key points. Start there and work outward.
So basically, your finance flowchart is like handing your auditor a map of how money moves through your company. They'll use it to spot where controls are (or should be) and figure out potential problem areas. Without it, they're just wandering around trying to piece things together - which honestly makes their job way harder. The flowchart helps them plan what to test and understand your processes before diving into the actual numbers. Just make sure it's up to date though. Nothing's more annoying than explaining why your flowchart shows processes you stopped using two years ago.
Dude, flowcharts are seriously amazing for this stuff. You map out every step visually and suddenly all the dumb inefficiencies just jump out at you. Like you'll see three people reviewing the same invoice and think "why tf are we doing that?" Missing approvals, pointless handoffs, stuff that should obviously be automated - it all becomes clear. Way better than those confusing meetings where nobody can explain the actual process. Honestly, I'd start with whatever's driving you most crazy right now. You'll probably spot the problem in like 10 minutes of sketching it out.
Honestly, flowcharts are a game-changer for financial stuff. Instead of wading through boring policy documents, you get a clear visual of who approves what and when. Start with your biggest headaches - like expense approvals or month-end procedures. Your auditors will actually thank you (which never happens lol). Training new people becomes so much easier too since they can just follow the arrows instead of deciphering paragraph after paragraph. I learned this the hard way after spending way too many late nights trying to explain our convoluted processes to confused teammates.
Think of it like a GPS for your accounting processes - shows new people exactly how transactions flow from start to finish. Way better than those boring procedure manuals nobody actually reads. You can walk them through each step, who approves what, when stuff gets escalated to managers. Honestly, it's a lifesaver when someone screws up because you can just point to the chart and be like "see, this is where you went wrong." I'd make different versions for each role though - no point overwhelming them with info they don't need right away.
Honestly, flowcharts are a game-changer for financial analytics. They show exactly how your data moves from the messy raw stuff through all the cleaning and calculations to your final reports. Super helpful when you're staring at numbers that don't add up - you can trace back and see where things went sideways. I always map out my process first because you'll spot bottlenecks you never noticed before. Plus stakeholders love seeing the visual breakdown of how you handle their data (makes audit season way less painful). Start with whatever process you're using now and just draw it out step by step.
Quarterly reviews are probably your sweet spot, but honestly? Do it whenever something major changes - new systems, process updates, whatever. Budget season's perfect timing since you're already knee-deep in everything anyway. Monthly quick checks aren't crazy if you're growing fast and stuff keeps shifting around. The real trick is making sure your flowchart matches what's actually happening, not some idealized version. I've seen too many that look pretty but are totally useless. Set a recurring reminder and give someone ownership of it - otherwise it'll sit there collecting digital dust forever. Trust me on that one.
Get the people who actually do this stuff day-to-day involved from the start. They'll catch things you'd never think of. Run workshops where everyone can walk through each step and point out what's broken or missing - honestly, I've watched so many "perfect" flowcharts completely bomb because nobody asked the actual users. Have them validate the flows and flag any compliance stuff early on. Don't just do this once either. Set up regular check-ins, maybe quarterly, so people can suggest changes based on what's really happening in practice.
-
The content is very helpful from business point of view.
-
I can say with full confidence that all your business, academic, or professional work requirements will be sufficed with SlideTeam. Their gallery is as rich as 2Million+!!