


Four Quadrant Supply And Demand Matrix




Try Before you Buy Download Free Sample Product
 Impress Your
 Audience
 100%
100% Editable
 Save Hours
 of Time


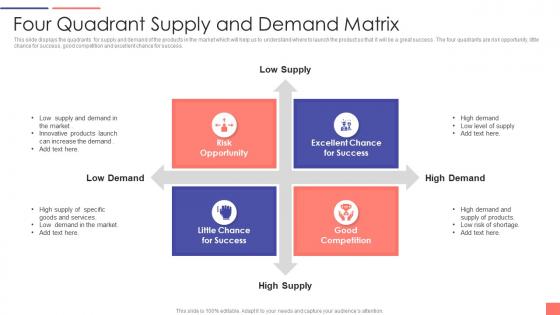
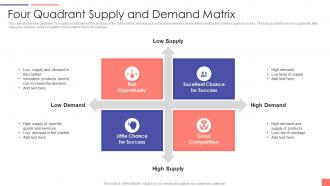
This slide displays the quadrants for supply and demand of the products in the market which will help us to understand where to launch the product so that it will be a great success. The four quadrants are risk opportunity, little chance for success, good competition and excellent chance for success.
People who downloaded this PowerPoint presentation also viewed the following :
Four Quadrant Supply And Demand Matrix with all 6 slides:
Use our Four Quadrant Supply And Demand Matrix to effectively help you save your valuable time. They are readymade to fit into any presentation structure.





FAQs for Four Quadrant Supply
So basically, supply and demand drive everything. More people want something but there's not enough? Price goes up. Too much of something sitting around with nobody buying? Price drops. Think about it - Taylor Swift tickets cost way more than some random local band, right? There's this sweet spot called equilibrium where everything balances out naturally. Honestly, once you get this concept, you can figure out why pretty much anything costs what it does. Super useful for business stuff.
Okay so basically when demand goes up, prices follow. Demand drops? Prices fall too. Supply's kinda the reverse though - more stuff available means cheaper prices, and when there's less supply, boom, prices shoot up. Think of it like buyers and sellers constantly pushing against each other until they find that sweet spot where the curves meet again. If you want to predict where prices are heading, just figure out what's actually causing the shift. Could be people having more money to spend, or maybe production got more expensive. I swear once you start noticing this pattern, you'll see it everywhere in your daily shopping.
Your demand goes up when people have more money to spend, obviously. Population growth in your target area helps too. Marketing campaigns can work wonders if done right - though honestly, some companies waste a ton on bad ads. Seasonal trends matter, plus shifts in what people actually want or how they live. Sometimes your competition screws up or raises prices, which is basically free customers for you. Cultural changes play a role as well. Keep tracking these patterns so you can adjust your pricing and stock levels before things shift.
So elasticity is basically how much people change their buying habits when prices move around. Take luxury stuff or anything with tons of alternatives - customers are super price-sensitive there. Bump the price up even a tiny bit and they'll either buy way less or just switch to something else. But with inelastic demand? People keep buying roughly the same amount no matter what because they actually need it. Gas and medicine are perfect examples - you can't really avoid those. I always tell people to check elasticity first when looking at any market because honestly, it saves you from making terrible predictions about what'll happen when prices shift.
So basically the government messes with supply and demand curves, which changes where they meet. Like cigarette taxes make them more expensive so people buy less - that's shifting demand left. Farm subsidies work the opposite way, making it cheaper for farmers to produce stuff so supply shifts right. Sales taxes hit consumers, subsidies help producers. I learned this the hard way studying for my econ midterm last semester lol. But yeah, whenever you're looking at a market, check what the government's doing first. Those interventions can totally flip your predictions about prices and quantities.
Honestly, it all comes down to what people actually want vs what they need. Coffee in Seattle? Super predictable demand because everyone's obsessed. Fashion though - that's a total nightmare to forecast since trends change every five minutes. Strong preferences = steady sales patterns. Wishy-washy preferences = you're gonna have some wild revenue swings. I'd probably look at how intense people feel about your product in different markets. Cultural stuff matters too - some places just care more about certain things. Grocery staples are boring but reliable, which isn't the worst problem to have.
More competition usually means more supply - pretty straightforward. Companies see profit potential and jump in, so you end up with tons of suppliers trying to grab market share. Coffee shops are a perfect example, they're literally everywhere now. But here's where it gets weird: sometimes fierce competition actually kicks out weaker players first, which can drop supply temporarily before things level out again. Oh, and don't just count competitors - check how much each one can actually produce. That combo gives you the real picture of what's happening supply-wise.
So basically, map out your demand curve first - see how customers react when you tweak prices. If a tiny increase kills your sales, you're hitting that sensitivity wall. Then factor in what it actually costs you to deliver. Most companies honestly just guess at pricing (which is wild), but this gives you real data to work with. Test small bumps and watch what happens. Short sentences work here. The trick is finding that spot where you're not leaving money on the table but also not scaring people away.
So basically when there's too much of something, sellers start cutting prices to get rid of their stuff - like those crazy post-Christmas sales. Shortages work the opposite way. Buyers end up bidding against each other, driving prices up. Markets usually fix themselves pretty quickly though, which is honestly pretty cool how that works. Prices adjust until supply and demand balance out again. Just watch out for things that might mess with this process - like when the government steps in or companies are slow to change their prices. Those can keep markets stuck out of whack longer than they should be.
So basically, stuff happening outside the market can totally mess with supply curves. Like if a hurricane wipes out factories, suddenly there's way less supply - curve shifts left. Tech improvements usually do the opposite though, making production cheaper and easier, so more goods at every price point. Weather's huge for farming obviously - one bad season and crop supply tanks. Oh and supply chain issues too, we definitely learned that one recently. The key thing is figuring out what's actually affecting producers' costs or their ability to make stuff in the first place.
So global trade basically messes with your supply and demand curves in crazy ways. Imports flood the market - more stuff available, prices drop, but local producers get screwed by competition. Exports do the flip side, dragging domestic supply overseas and bumping up prices here. Currency swings make everything even weirder since they change how competitive your exports are. Oh, and don't forget tariffs can artificially twist these curves around too. You really can't look at domestic markets alone anymore - international pressures are always pushing things around. It's honestly pretty chaotic when you think about it.
So market equilibrium is where supply and demand curves cross - that's your magic spot. At this point, what suppliers want to sell perfectly matches what buyers want to purchase at that exact price. Picture hunting for this intersection when you're doing analysis because it gives you the market-clearing price and quantity. Above or below this point? You'll get surpluses or shortages that naturally push everything back to balance. Honestly, once you plot both curves, finding that sweet spot becomes pretty straightforward - just look for where they meet.
Dude, the biggest thing people get wrong is thinking markets react instantly - total BS. Prices change but demand takes forever to catch up. Rich people don't even care about price hikes while everyone else freaks out, which messes up those neat little graphs we learned about. Supply's another nightmare because companies can't just magically produce more stuff overnight. Oh, and demand curves? They're not these perfect straight lines - they're all wonky and bent depending on what you're selling. I swear economics textbooks make it sound way simpler than reality.
People buy stuff in pretty predictable patterns throughout the year. Winter coats and swimwear are obvious, but it gets weird - like soup sales jump 30% when it's cold out. Tax software explodes in spring. Everyone joins gyms in January (we both know how that ends lol). Thing is, you can use these patterns to forecast demand way better. I'd grab 2-3 years of your sales data and break it down month by month. You'll start seeing your own seasonal cycles pop up. Makes planning inventory so much easier when you know February's gonna be slow but March picks up.
Honestly, just start with whatever historical data you've got. Moving averages or ARIMA models work well if you see clear patterns over time. Regression's solid too - lets you factor in stuff like pricing changes or seasonal trends. I've seen people go crazy with neural networks and machine learning, but that's probably overkill unless you're Amazon or something. Most smart companies mix the quantitative stuff with actual market research and gut instincts from people who know the business. Pick the simplest approach that gives decent accuracy first, then get fancy later if you need to.
-
I took a chance with SlideTeam. I never looked back. Great products and great service.
-
Great quality slides in rapid time.