


Four Stages Of Business Intelligence Process Ppt Powerpoint Presentation File Aids




Try Before you Buy Download Free Sample Product
 Impress Your
 Audience
 100%
100% Editable
 Save Hours
 of Time


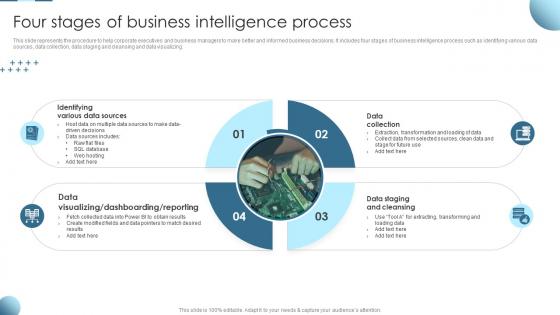
This slide represents the procedure to help corporate executives and business managers to make better and informed business decisions. It includes four stages of business intelligence process such as identifying various data sources, data collection, data staging and cleansing and data visualizing.
People who downloaded this PowerPoint presentation also viewed the following :
Four Stages Of Business Intelligence Process Ppt Powerpoint Presentation File Aids with all 6 slides:
Use our Four Stages Of Business Intelligence Process Ppt Powerpoint Presentation File Aids to effectively help you save your valuable time. They are readymade to fit into any presentation structure.





FAQs for Four Stages Of Business Intelligence Process Ppt Powerpoint
So BI basically breaks down into four steps: collecting data, integrating it, analyzing, then visualizing everything. You'll pull info from databases, spreadsheets, APIs - whatever sources you've got. Integration comes next where you clean everything up and get it into one consistent format. Honestly this part is boring as hell but you can't skip it. Analysis is where the fun happens - finding patterns and running models on your data. Last step is building dashboards and reports so people can actually understand what you found. Oh, and seriously spend extra time on that integration phase. Bad data going in means useless results coming out.
Your BI is only as good as the data you're feeding it, honestly. Garbage in, garbage out - that's the brutal truth. Automated collection beats manual every time because humans make mistakes (myself included lol). You'll want standardized pipelines from day one, otherwise you're building insights on shaky ground. Inconsistent sources are where everything falls apart. I'd start by looking at what you're currently doing - audit those collection methods and see where the weak spots are. Clean, validated data sources make all the difference between actually knowing what's happening versus just guessing.
So basically data warehousing is like having one clean place where all your business info lives. You pull stuff from your CRM, ERP, marketing tools - whatever systems you're using - and it gets cleaned up and organized properly. Honestly, trying to analyze scattered messy data is a nightmare, trust me. The warehouse gives you that single source of truth so when you're building dashboards later, you know the data actually makes sense and matches up. Short sentences work better sometimes. Figure out which data sources matter most to you first, then start connecting those.
Honestly, you've gotta bake quality checks straight into your pipeline from day one. Set up automated rules to catch duplicates, missing data, all that messy stuff before it tanks your reports. I've watched so many dashboards turn into garbage because people just trusted their source data blindly - rookie mistake. Profile your data regularly and document the weird stuff you find. Someone needs to own each data source too, not just dump everything on IT. Oh, and train your business users to actually speak up when numbers look off instead of just shrugging.
So you'll mostly see bar charts, line graphs, pie charts - the usual suspects. Dashboards are huge since they let you throw multiple visuals together. Heat maps show data density pretty well, scatter plots for finding correlations. Boring old tables are still everywhere tbh, even though everyone wants the flashy stuff. Geographic mapping when location's relevant, tree maps for hierarchical data. Tools like Tableau make this stuff way easier than it used to be. Honestly though? Start basic and work up - I've seen too many people go overboard with complex visuals and confuse the hell out of their audience.
So predictive analytics comes right after you get your descriptive stuff sorted out. Takes all that historical data and basically tries to predict what's coming next - you're going from "what happened" to "what'll probably happen." This is where things get fun because you can actually get ahead of problems instead of just reacting to them. Just make sure your data isn't a mess first, then you can add the fancy machine learning bits. I'd start with something straightforward like sales forecasting or figuring out which customers might bail. Pick whatever you have decent historical data for and where it'll actually move the needle business-wise.
Okay so budget and how techy your team is matters a lot here. Power BI or Tableau are solid starting points - both pretty intuitive but pack a punch. Snowflake's great for data warehousing, AWS Redshift too. Here's the thing though - I've watched so many teams get paralyzed trying to find the "perfect" setup instead of just diving in somewhere. If you're already using Microsoft stuff, Power BI's honestly a no-brainer since it plays nice with everything. Python works well for ETL if anyone codes, otherwise maybe Alteryx. My take? Grab one viz tool, pick a data platform, then expand. Don't overthink it initially.
So instead of just winging it with gut decisions, BI shows you what's actually happening with your business through real data. You'll get dashboards that track customer patterns, sales trends, all that stuff in real-time. Honestly, it's pretty eye-opening once you see the actual numbers vs what you thought was going on. You can catch issues before they blow up and spot opportunities you might've missed. The trick is starting simple though - pick one specific question you need answered (like "why are we losing customers?") and build from there. Don't try to analyze everything at once or you'll get overwhelmed.
Oh man, data silos are gonna be your worst enemy - nothing talks to each other properly. Legacy systems are another pain point since they weren't designed for modern BI tools. Honestly, some of these old databases feel ancient. Teams will fight you too because nobody wants to learn new processes. I'd say pick one department first, maybe something straightforward like sales? Get a quick win there to show it actually works. Once people see the value (and trust me, they need to see it), rolling it out becomes way easier. Don't try to boil the ocean right away.
Pick BI software that actually fits what your team can handle. I've watched so many companies get stuck with tools that are either too complex or too basic. Some platforms are amazing for deep analytics but take forever to learn. Others make pretty dashboards but can't handle serious number-crunching. Test drive whatever you're considering first – and I mean with YOUR real data, not their polished demos. Build the actual reports you need day-to-day. You'll figure out pretty quickly if it's gonna work or just frustrate everyone for months.
Okay so three main things to watch out for: data privacy, bias, and being transparent about your limitations. First off, only use data you actually have permission for and anonymize any personal info - trust me, you don't want to be that person who leaked customer details. Check for sampling bias too since that can really mess with your results and make them favor certain groups. Oh and document everything! Be honest about data quality issues or whatever assumptions you're making. I've seen people get burned by overselling what their analysis actually shows. Just be straight up about what the data can and can't tell you.
So you want to measure BI ROI? Track the obvious stuff first - cost savings from cutting manual reports, fewer screw-ups, faster decisions. Revenue boosts from better insights matter too, like spotting new opportunities or tweaking pricing. Honestly, the "soft" benefits are where it gets messy - data quality improvements and happier employees are real but hard to quantify. Set your baseline before you start, then check progress every quarter. Most companies I've seen hit 3-5x ROI in about 18 months, but only if they actually act on what the data tells them.
Dude, the big thing right now is self-service analytics - finally letting business users build their own dashboards instead of always bothering IT. Real-time data processing is huge too. Cloud-native platforms are basically taking over because they scale better and cost less. Oh, and natural language stuff is actually getting decent now? Your team can just ask "what were sales last quarter" instead of writing those annoying queries. Embedded analytics are popping up everywhere, which makes sense since people want insights right in their workflow. I'd probably start with whatever fixes your biggest pain point first.
Honestly, it's mostly about scale. Small businesses can totally get by with basic dashboards and spreadsheet exports - nothing fancy needed. Enterprises though? They're juggling multiple data sources, tons of stakeholders wanting different reports, plus all those compliance headaches. So they need dedicated BI teams, proper data warehouses, the whole nine yards. I'd say start simple for now - maybe I'm biased but I've seen too many small companies blow their budget trying to build enterprise-level stuff they don't actually need yet. You can always upgrade as you grow.
Honestly, SQL is where you should start - you'll be swimming in databases constantly. Grab either Tableau or Power BI for visualizations, and yeah, Excel's still annoyingly relevant everywhere. Some stats background helps too. But here's the thing - being able to actually talk to people matters just as much. You're basically translating nerd speak into business language all day. Critical thinking's huge since you'll solve weird problems constantly. Oh, and don't underestimate how much time you'll spend in meetings explaining why the data shows what it shows. Master SQL plus one viz tool first though - that combo gets you in the door pretty much anywhere.
-
Placing an order on SlideTeam is very simple and convenient, saves you a lot of your time.
-
The PPT layout is great and it has an effective design that helps in presenting corporate presentations. It's easy to edit and the stunning visuals make it an absolute steal!