


Fuel gauge four clockwise speedometers


Try Before you Buy Download Free Sample Product
 Impress Your
 Audience
Editable
of Time


Our Fuel Gauge Four Clockwise Speedometers will embrace your thoughts. They will recieve a lot of affection.
People who downloaded this PowerPoint presentation also viewed the following :
Content of this Powerpoint Presentation
Description:
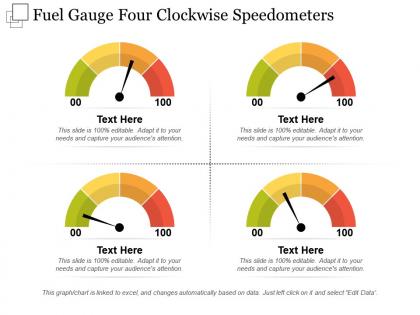
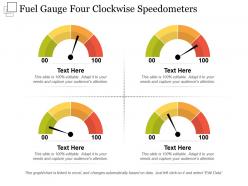
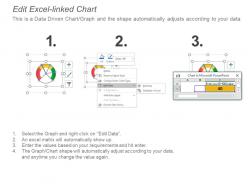
The image displays a PowerPoint slide titled "Fuel Gauge Four Clockwise Speedometers," featuring four gauge-style graphics resembling car speedometers or fuel gauges. Each gauge has a scale from 0 to 100 and is color-coded from green to red, suggesting a progression from good to critical performance levels. The gauges' needles are set at various positions, indicating different levels of measurement.
Additionally, it notes that "This graph/chart is linked to excel, and changes automatically based on data. Just left click on it and select 'Edit Data'." This suggests the gauges can dynamically update based on external data sources.
Use Cases:
These visualizations are versatile and can be used across various industries to represent performance metrics, satisfaction levels, or other quantifiable data:
1. Automotive:
Use: Displaying vehicle performance or factory efficiency metrics.
Presenter: Quality Assurance Manager
Audience: Production team, engineers
2. Energy:
Use: Monitoring power usage or efficiency of different plants.
Presenter: Plant Operations Director
Audience: Technicians, energy analysts
3. Healthcare:
Use: Tracking patient satisfaction scores or treatment success rates.
Presenter: Hospital Quality Manager
Audience: Medical staff, hospital administrators
4. Financial Services:
Use: Showing investment portfolio performance or market position.
Presenter: Financial Analyst
Audience: Investors, portfolio managers
5. Customer Service:
Use: Measuring support team response times or customer satisfaction levels.
Presenter: Customer Service Lead
Audience: Service team, management
6. Sales:
Use: Representing sales targets, quota completions, or regional performance.
Presenter: Sales Director
Audience: Sales representatives, marketing team
7. Education:
Use: Illustrating student performance, attendance rates, or school ranking.
Presenter: Educational Analyst
Audience: Teachers, school board members
Fuel gauge four clockwise speedometers with all 6 slides:
Establish your footprint on this earth with our Fuel Gauge Four Clockwise Speedometers. Evolve and emerge as a force to consider.
-
Qualitative and comprehensive slides.
-
Informative design.