

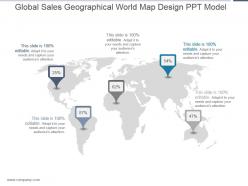
Global sales geographical world map design ppt model





Try Before you Buy Download Free Sample Product
 Impress Your
Audience
 100%
Editable
 Save Hours
of Time


Our Global Sales Geographical World Map Design Ppt Model allow for adequate thought. They discourage hasty action.
People who downloaded this PowerPoint presentation also viewed the following :
Global sales geographical world map design ppt model with all 5 slides:
Come out a winner with our Global Sales Geographical World Map Design Ppt Model. Your ideas will top the leaderboard.


FAQs for Global sales geographical world map
Key elements include geographic accuracy, data visualization clarity, market segmentation boundaries, sales territory divisions, and performance indicators. These components work together by enabling strategic territory planning, identifying market opportunities, and tracking regional performance metrics, with many organizations finding that well-designed sales maps streamline resource allocation and enhance competitive positioning across international markets.
Geographical data enhances sales performance understanding by visualizing revenue patterns, identifying market penetration gaps, and revealing regional customer behavior trends across territories. Through interactive mapping technologies, organizations can analyze demographic correlations, optimize resource allocation, and pinpoint expansion opportunities, with many retail and manufacturing companies finding that location-based insights ultimately deliver more targeted strategies and improved regional profitability.
**INPUT**: What software tools are best suited for creating interactive global sales maps? **OUTPUT**: Leading software tools for interactive global sales maps include Tableau, Power BI, ArcGIS Online, Google Data Studio, and D3.js-based platforms. These technologies streamline data visualization by enabling real-time updates, drill-down capabilities, and seamless integration with CRM systems, with many sales organizations finding that interactive mapping enhances territory planning and accelerates decision-making processes. **Word count: 56 words**
Visual hierarchy improves sales data clarity by using size variations, color gradients, strategic positioning, and contrast levels to guide viewer attention to key insights. Through larger markers for high-performing regions, darker colors for priority markets, and prominent placement of critical metrics, organizations streamline data interpretation, enhance decision-making speed, and ultimately deliver more actionable sales intelligence across territories.
Colors serve as the primary visual encoding mechanism for sales data on global maps, typically using gradient scales, categorical distinctions, heat mapping, and threshold-based color coding to represent performance levels, regional comparisons, and data ranges. Through strategic color application, organizations can instantly communicate sales patterns, identify high-performing markets, and highlight growth opportunities across territories, ultimately enabling faster strategic decisions and more effective resource allocation in competitive global markets.
Global sales maps showcase trends over time by incorporating dynamic elements like color gradients, animated sequences, and multi-year comparisons that highlight regional performance changes. Through interactive features and timeline controls, organizations can visualize quarterly growth patterns, seasonal fluctuations, and market expansion across different territories, ultimately enabling strategic decision-making and resource allocation based on clear geographical performance data.
Best practices for incorporating demographic data into sales maps include using color-coded overlays, interactive filtering systems, layered visualizations, clear legends with population segments, and targeted territory boundaries aligned with customer profiles. These approaches enhance sales presentations by revealing market opportunities, identifying underserved regions, and enabling strategic resource allocation, ultimately delivering more precise targeting strategies and competitive market positioning for sustained growth.
Layering information combines multiple data dimensions on a single visualization, enabling sales teams to identify correlations between performance metrics, demographic patterns, and market opportunities simultaneously. This strategic approach streamlines territory planning, resource allocation, and customer targeting by revealing insights that isolated data cannot, ultimately delivering more precise sales strategies and competitive advantage.
Common pitfalls include using inaccurate data, poor color schemes that confuse rather than clarify, overcrowding maps with excessive information, neglecting mobile responsiveness, and failing to update regional performance data regularly. These design mistakes can mislead sales teams and executives, ultimately compromising strategic decision-making, resource allocation, and market expansion efforts across international territories.
Global sales maps enhance strategic decision-making by visualizing revenue patterns, identifying high-potential markets, tracking competitor presence, and revealing geographic performance gaps across regions. Through comprehensive data visualization, organizations can optimize resource allocation, prioritize market expansion efforts, and adjust regional strategies, with many multinational companies finding that these maps ultimately deliver more targeted investments and accelerated growth in underperforming territories.
Customer feedback can be integrated into sales map design through survey data analysis, customer journey mapping, satisfaction score overlays, behavioral pattern tracking, and regional preference identification. These insights enable sales teams to optimize territory boundaries, prioritize high-satisfaction regions, and adjust resource allocation based on customer needs, ultimately delivering more targeted approaches and enhanced customer experiences across different markets.
Mobile responsiveness significantly enhances global sales map effectiveness by ensuring clear visibility, interactive functionality, and seamless navigation across all devices during presentations. Through responsive design, sales teams can deliver compelling presentations in various settings, from boardrooms to client meetings, while maintaining data accuracy and visual impact, ultimately enabling more flexible and engaging stakeholder communications.
Local scales work best for regional teams, branch offices, and territory-specific presentations, while global scales suit executive dashboards, international strategy meetings, and company-wide performance reviews. The choice depends on audience decision-making scope, with sales managers benefiting from detailed regional views and C-suite executives requiring worldwide perspective, ultimately enabling more targeted insights and strategic alignment across organizational levels.
Animation and interactive features enhance global sales maps by enabling real-time data visualization, clickable regional drill-downs, and dynamic filtering capabilities. These elements transform static presentations into engaging experiences, with sales teams finding that animated trend displays, hover-over details, and customizable time ranges significantly improve stakeholder engagement and decision-making speed.
**INPUT**: What data visualization techniques can make complex sales data more comprehensible on a map? **OUTPUT**: Effective techniques include color-coded heat mapping, proportional symbols, layered data overlays, interactive drill-down capabilities, and dynamic filtering options. These visualization methods streamline complex datasets by highlighting regional performance patterns, enabling territory comparisons, and providing scalable insights, with many sales organizations finding that strategic visual design ultimately enhances decision-making speed and territorial planning accuracy.
-
Excellent Designs.
-
Informative presentations that are easily editable.