

Healthcare dashboard with appointment status current month





Try Before you Buy Download Free Sample Product
 Impress Your
Audience
 100%
Editable
 Save Hours
of Time


Convince folks that you are an excellent host with our Healthcare Dashboard With Appointment Status Current Month. It helps display your hospitality.
People who downloaded this PowerPoint presentation also viewed the following :
Content of this Powerpoint Presentation
Description:
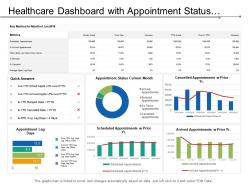
The image is a PowerPoint slide titled "Healthcare Dashboard with Appointment Status." It's a composite visual dashboard used for displaying various healthcare metrics and trends over time. The slide is segmented into several sections:
1. Key Metrics for Month of Jun 2018:
It shows actual and previous year's data on scheduled and arrived appointments, percentages of no-shows, same-day cancellations, bumps, and cancellations. It also shows the average lag days for appointments.
2. Quick Answers:
This section provides a yes or no status on whether certain metrics have met their year-to-date targets compared to the previous year, such as scheduled appointments, arrival rates, bumped rates, cancellation rates, and average lag days.
3. Appointment Status Current Month:
A pie chart categorizing appointments by status, including arrived, bumped, no-show, and cancelled.
4. Cancelled Appointments w Prior Yr.:
A bar chart comparing monthly cancelled appointments with the previous year.
5. Scheduled Appointments w Prior Yr.:
A bar chart that compares the number of scheduled appointments for each month with the previous year.
6. Arrived Appointments w Prior Yr.:
Similar to the above but for arrived appointments.
7. Appointment Lag Days:
A bar chart showing the average number of days between scheduling and the appointment for different categories.
The slide also contains a note indicating that the graph/chart is linked to Excel and can be edited by clicking and selecting "Edit Data." This implies that the data is dynamic and can be updated as needed.
Use Cases:
Now, let’s explore the seven industries where similar types of slides can be utilized, their use, the typical presenter, and the audience:
1. Healthcare
Use: Tracking patient appointments and clinic performance.
Presenter: Healthcare Administrator
Audience: Medical staff, management
2. Education
Use: Monitoring student enrollment and attendance trends.
Presenter: School Administrator
Audience: Teachers, educational staff
3. Hospitality
Use: Analyzing booking and occupancy rates.
Presenter: Hotel Manager
Audience: Hotel staff, stakeholders
4. Retail
Use: Assessing customer footfall and service appointments.
Presenter: Store Manager
Audience: Retail employees, marketing team
5. Transportation
Use: Reviewing ticket bookings and passenger arrivals.
Presenter: Operations Analyst
Audience: Management team, operational staff
6. Banking
Use: Managing appointment scheduling and client meeting trends.
Presenter: Branch Manager
Audience: Bank employees, customer service team
7. Fitness and Wellness
Use: Tracking class sign-ups and attendance rates.
Presenter: Gym Manager
Audience: Trainers, gym staff
Healthcare dashboard with appointment status current month with all 6 slides:
Delve into all the facts involved with our Healthcare Dashboard With Appointment Status Current Month. It helps investigate the issue.
FAQs for Healthcare dashboard with appointment
Start with patient stuff - mortality rates, readmissions, satisfaction scores. That's your bread and butter. Then add operational metrics like bed occupancy, length of stay, ER wait times (because honestly, those waits are brutal). Financial side matters too - cost per patient, revenue per bed, staff productivity. Oh, and quality measures like infection rates and med errors are huge. Keep your dashboard clean though - maybe 8-12 main metrics tops, then you can dig deeper when you need specifics. Too many numbers just makes everyone's eyes glaze over.
So real-time data integration basically makes your healthcare dashboard actually useful instead of just showing old info. You'll see patient admissions, lab results, vitals - everything updating as it happens rather than checking yesterday's numbers. Makes such a difference when you're trying to make decisions fast during crazy shifts. Trends pop up right away, you can catch problems early, and honestly you actually trust what you're looking at. I'd start with whatever data sources update most often in your system - that's where you'll see the biggest impact first. Way better than constantly refreshing static reports.
Honestly, patient engagement should guide pretty much everything when you're building a healthcare dashboard. People won't use another app that just sits there - they need actual reasons to come back. Make the health data feel less scary and more manageable with visuals that actually make sense. Goal tracking works great, or maybe quick ways to message their doctor. I've noticed the best ones focus on changing behavior, not just showing a bunch of numbers. Short wins help too - like celebrating when someone hits their step goal or whatever. The whole point is getting them actively involved in their care.
So dashboards are actually great for this - you can see patterns in patient data that would take forever to find otherwise. Like readmission rates or seasonal flu spikes just pop out when they're graphed. Way better than staring at spreadsheets all day (learned that the hard way). Filter by date ranges or departments to dig deeper into specific trends. You'll catch early outbreak warnings or figure out which treatments actually work. Honestly, focus on your most critical metrics first - that's where you'll notice the biggest differences. The visual format makes everything click faster than trying to analyze raw numbers.
Honestly, less is more with healthcare dashboards. Put your critical stuff like patient safety right at the top - that's non-negotiable. Red for urgent, green for good, but skip the rainbow nonsense that makes people's heads hurt. Bar charts beat fancy visualizations every time because doctors are already exhausted, you know? Group similar data together so it flows logically. Always show normal ranges or benchmarks - otherwise that random number means nothing. Test with real users first though, seriously. What makes sense to you might be totally confusing to someone trying to save lives at 3am.
Look, healthcare dashboards are game-changers because you get live data instead of waiting around for those useless monthly reports that tell you what happened weeks ago. You'll see stuff like bed availability, staffing levels, and patient satisfaction in real-time. Makes it way easier to catch problems early and actually do something about them. The key is tracking patient flow, resource use, and quality metrics so you can make quick decisions about where to put your people and resources. Honestly, I'd start small though - pick your biggest 3-5 headaches and build around those first. No point overwhelming yourself with data you won't use.
Start by figuring out what each type of user actually needs day-to-day. Doctors want clinical alerts right up front, but admins need operational stuff. Role-based permissions are clutch here. Your navigation has to be dead simple - nobody's got time to dig through menus during a crazy shift. Clean visuals with good color-coding help people scan info fast. Mobile matters since everyone's checking dashboards between patients anyway. Oh, and drill-down capability is key - let people go from big picture to detailed reports when they need specifics. Contextual tooltips save you from constant training too.
Focus on readmission rates, length of stay, mortality rates, and patient satisfaction - those really tell the story. Trend lines work great for spotting patterns, and color-coded alerts make problems pop right out. Honestly, the visual stuff is half the battle here. Your EMR can probably feed data automatically, which saves tons of time. Executives just want the big picture while clinical teams need to dig deeper, so build different views for each group. Oh, and don't go crazy at first - pick 3-4 key metrics and add more later once people actually start using it.
Start with role-based access and MFA - that's your foundation. Encrypt data at rest and in transit because healthcare breaches will literally bankrupt you. Audit trails are crucial for tracking who saw what and when. Auto session timeouts too. Keep everything patched and do regular security assessments. Honestly, I'd audit current access permissions first since that's usually where the biggest holes are. Think of it like locking down a house - multiple locks, cameras, the works. Someone's always probing for weak spots, so don't give them any easy wins.
Honestly, these dashboards are total lifesavers for tracking everything in real-time - bed counts, staffing, equipment, supplies, all of it. You'll catch problems way earlier, like ICU filling up or running out of critical stuff. The predictive stuff is pretty cool too; helps you actually plan ahead with staffing instead of scrambling last minute. My cousin works at a hospital and says it completely changed how they operate. Start with whatever's causing you the biggest headaches right now and build your metrics around that first.
Honestly, data integration is going to be your biggest headache - nothing talks to each other properly. HIPAA compliance will drag everything out too, which is annoying but unavoidable. Staff pushback is real though, doctors and nurses are already swamped and won't want another thing to monitor. You'll definitely need solid IT backup for when stuff breaks. Oh, and make sure it actually saves time instead of adding more busy work (learned that one the hard way). I'd start with just one department first. Get them on board, then expand from there once you've worked out the kinks.
So predictive analytics is like giving your healthcare dashboard superpowers - you're not just seeing what already happened, you're getting forecasts about patient outcomes and resource needs. Which patients might get readmitted? When will you hit capacity? Are someone's vitals screaming trouble ahead? That kind of thing. Honestly, the best part is catching problems before they blow up instead of scrambling afterward. I'd start by figuring out your biggest headaches first, then see what predictive models could give you those early warning signs. It's pretty wild how much you can actually see coming if you know where to look.
Dude, dashboards are honestly game-changers for healthcare ops. Instead of everyone calling around asking "what are our numbers today?" you just pull up one screen and boom - everything's there in real time. No more waiting for yesterday's reports or digging through different systems. Your team spots problems way faster, which is huge. I swear half the battle in healthcare is just knowing what's actually happening right now across your whole organization. My advice? Look at where your staff waste the most time hunting for data daily - that's probably where you'd see the biggest wins from automating those pulls.
User feedback is everything - seriously, it's the difference between a dashboard people actually use vs one that just sits there looking nice. Real workflows are messy and weird in ways developers never expect. Like when nurses tell you they desperately need med alerts right up top, or doctors are begging for faster patient searches. That's pure gold right there. Set up feedback loops through surveys, interviews, usage data - whatever works. Focus on patterns from multiple users though, not just random complaints. Oh, and definitely start with your power users since they know exactly what's broken.
Honestly, AI stuff is where all the cool developments are happening right now. Predictive analytics can catch when patients are going downhill before anyone notices - pretty wild. Real-time data pulls from everything now too: IoT devices, wearables, EHRs, the whole ecosystem. Voice commands don't totally suck anymore either! Natural language processing lets doctors just ask questions instead of clicking around forever. Dashboards are getting smarter about adapting to what you actually need based on your role. Oh, and personalized alerts that don't cry wolf every five minutes. I'd definitely look into vendors doing AI-powered clinical decision support - that's where you'll see real results.
-
Amazing product with appealing content and design.
-
I discovered this website through a google search, the services matched my needs perfectly and the pricing was very reasonable. I was thrilled with the product and the customer service. I will definitely use their slides again for my presentations and recommend them to other colleagues.