

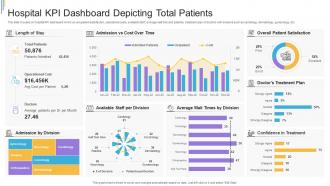
Hospital KPI Dashboard Depicting Total Patients





Try Before you Buy Download Free Sample Product
 Impress Your
Audience
 100%
Editable
 Save Hours
of Time


This slide focuses on hospital KPI dashboard which covers patient satisfaction, operational costs, available staff, average wait time and patients, treatment plan of doctors with divisions such as cardiology, dermatology, gynecology, etc.
People who downloaded this PowerPoint presentation also viewed the following :
Hospital KPI Dashboard Depicting Total Patients with all 7 slides:
Use our Hospital KPI Dashboard Depicting Total Patients to effectively help you save your valuable time. They are readymade to fit into any presentation structure.






FAQs for Hospital KPI Dashboard
Start with patient safety stuff - infection rates and readmissions are huge. Then track your operational basics like bed occupancy and ER wait times (those always get messy). Financial metrics matter too - revenue per patient, cost per case. Oh, and don't forget quality outcomes like patient satisfaction scores. Honestly, I've seen places try to track like 20 different things and it becomes chaos. Stick to maybe 8-10 max so people actually pay attention. Set up alerts for the critical stuff so your team knows when something's going sideways fast.
Honestly, these dashboards are pretty clutch for hospitals. You get real-time data instead of waiting weeks for reports that are already stale. Patient wait times, bed availability, staff schedules - it's all right there. Way easier to catch issues before they blow up into major problems. Plus you can actually see if the changes you're making are working or just wasting time (which happens more than people admit). Resource allocation becomes way less of a guessing game too. Start with maybe 5-7 key metrics that matter most to your department and update daily at minimum.
Look, real-time data is a total game changer - you can actually fix problems while they're happening instead of reading about yesterday's mess over coffee. Six-hour-old data? Might as well be from last week when you're trying to manage bed shortages or crazy wait times. Set up alerts for the scary stuff so you're not glued to your screen 24/7. Live metrics for occupancy and staffing levels mean you can jump on issues before they explode. Just make sure your feeds are actually real-time, not some "updated twice daily" nonsense that half the vendors try to pass off.
Honestly, EHR integration is a game changer for dashboard accuracy. You're cutting out all those manual data entry mistakes that make your metrics look sketchy. Docs and nurses are already putting everything in the system anyway - patient info, length of stay, readmission rates. Why not pull it straight from there? Real-time updates mean you're seeing what's happening right now instead of stale numbers from last week. Sure, you'll still hit some messy data fields here and there, but way better than typos killing your KPIs. I'd start by looking at whatever metrics your team is manually tracking now and tackle those first.
Honestly, you can't go wrong with Tableau or Power BI for hospital dashboards. Tableau's what most healthcare places I know use - it's kind of the gold standard but costs more. Power BI's cheaper though, and if you're already on Microsoft stuff it just works better together. QlikView's decent too, especially for real-time updates. The main thing is getting clean visuals that don't overwhelm people with too much data at once. Oh, and definitely check what your IT team already knows how to support first - makes life way easier down the road.
So grab your HCAHPS data and set up tiles for overall satisfaction, communication, and pain management - leadership always obsesses over those three. Monthly data means there's gonna be some lag compared to your real-time stuff, which is annoying but whatever. Set alerts when scores tank below your targets. The key thing is making sure you can drill down by unit or department. Otherwise you're just looking at numbers that don't help anyone. Actually had this same setup at my last place and it saved us so much time chasing down problem areas instead of playing guessing games.
Look, KPI dashboards basically give you x-ray vision into what's actually happening. You'll see bed occupancy rates, staff-to-patient ratios, all that stuff in real time. Super handy when the ER is slammed but surgery's sitting around - you can move people where they're needed. Equipment usage shows up too, so no more guessing games when ordering supplies. Set up alerts for the critical stuff and you can fix bottlenecks before they mess with patient care. Honestly saved my butt more times than I can count. The trick is not going overboard with too many metrics though.
Each department needs different stuff on their dashboard - ER wants wait times and bed availability, ICU tracks mortality and infection rates, finance cares about revenue metrics. Pretty obvious when you think about it. Here's what I'd do: ask each department head what 3-5 numbers they actually check every morning, not what sounds impressive. Most places have way too much data nobody looks at anyway. Build a basic template first, then swap out widgets based on what they really need for decisions. The goal is making their daily workflow easier, not cramming every possible metric onto one screen.
Data silos are going to be your worst nightmare - hospitals have info spread across like 15 different systems that hate each other. Staff won't use it either because they're already buried in alerts. Pick maybe 3 KPIs that people actually give a damn about first. Don't try to boil the ocean right away. Get your end-users involved in choosing what matters or you're screwed from day one. Keep the dashboard stupid simple - something they can read in 2 seconds while walking past. Oh, and make sure the metrics connect to stuff people can actually control, not just vanity numbers for executive presentations.
Pick 3-4 core metrics first - readmission rates, length of stay, infection rates, patient satisfaction. Get your baseline numbers before launching anything. Then track those exact same metrics for 6-12 months after your dashboard goes live. Honestly, don't expect crystal clear connections right away since there's always other stuff happening that affects outcomes. Also check if people are actually using the thing. Are they logging in? Making decisions faster? I've seen too many dashboards that look pretty but just sit there collecting dust. The trick is being consistent with your measurements and not getting discouraged if the impact takes a while to show up.
Start with the money stuff - days in A/R, denial rates, cash collection percentages. These hit your cash flow directly. Patient volume and case mix index matter too since you need the right types of cases coming in. Cost per case is huge, and honestly? Length of stay affects literally everything else. I'd track operating margin by service line - shows you which departments actually make money vs. just look busy. Oh, and don't overwhelm your team right away. Get comfortable with these basics first, then you can always layer on more detailed metrics later.
Honestly, daily updates work for most hospital KPIs - that's your safe starting point. But some stuff needs way more attention. Patient census and bed availability? Those should probably update hourly or even live since things move so fast. Quality metrics are different though - weekly is fine since they don't swing around much day to day. I'd match how often you refresh each metric to how quickly it actually changes and whether your team needs that info RIGHT NOW to make decisions. Start daily, then tweak based on what people are actually checking and when they're panicking for fresh numbers.
Honestly, just focus on showing each department what actually matters to them - like, why would nurses care about finance dashboards? Make some quick video tutorials they can watch later when they inevitably forget everything from the first session. Pick a few tech-savvy people in each unit to be your go-to helpers when things get confusing. Regular refresher sessions work well, and departments love competing against each other if you make it fun. Oh, and definitely ask people what's tripping them up so you can fix the training. That feedback's usually pretty eye-opening.
Your dashboard's perfect for this - just pull up readmission rates, patient satisfaction, length of stay, mortality rates and stack them against industry benchmarks. Most platforms let you overlay that benchmark data directly on your charts which is honestly pretty satisfying when you can see at a glance where you're winning. Filter by hospital size or patient type though, otherwise you're comparing a tiny rural clinic to Mayo Clinic. The cool part? Once you spot who's crushing certain metrics, you can dig into what they're doing differently and steal their playbook.
Definitely start with role-based access - that's like 80% of your security issues right there. Get HTTPS running if you haven't already, and encrypt everything at rest too. Multi-factor auth is annoying but worth it. Anonymous patient data in your visualizations whenever you can swing it. Oh, and audit your current dashboard permissions first - I bet you'll find people with access who shouldn't have it anymore. Security audits should be regular, not just when something goes wrong. Honestly though, fixing who can see what will solve most of your headaches immediately.
-
Great designs, really helpful.
-
Excellent products for quick understanding.