


Hospital performance data scorecard powerpoint presentation slides





Try Before you Buy Download Free Sample Product
 Impress Your
 Audience
 100%
100% Editable
 Save Hours
 of Time


The Hospital Performance Data Scorecard plays a significant role in the effective management of healthcare organizations by mapping its growth objectives with quantifiable KPIs. These impeccably designed scorecards can be used by Health Managers to further improve their organization performance by building a solid Financial Base, achieving a targeted Patient Base, and delivering Cost-Effective Care. Check out our insightfully designed Hospital Performance Data Scorecard that will monitor the hospital performance on multiple KPIs such as Patient Satisfaction Rate, Operational Cost, Total Admission by Division, Bed Occupancy Rate, Inpatient Mortality Rate. Also, this PowerPoint deck contains Dashboards to visually present the Patient Admission and Readmission Rate, Outpatient vs. Inpatient Trends, Average Waiting Time by Division, Physician Performance. Additionally, the health executives can use the PPT Scorecards to evaluate the hospital performance department-wise, such as Pediatric Ward, Nutrition Rehabilitation Center, Special Newborn Care Units, ICU, Laboratory, and Blood Bank. Book a free demo with our design or research team and customize this 100 percent editable template based on your specific business requirements. Download it now.
People who downloaded this PowerPoint presentation also viewed the following :
Content of this Powerpoint Presentation
Slide 1: This slide shows title i.e. 'Hospital Performance Data Scorecard'.
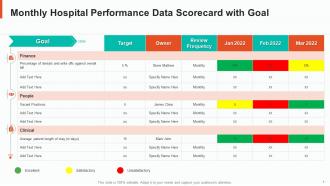
Slide 2: This slide displays 'Monthly Hospital Performance Data Scorecard with Goal'.
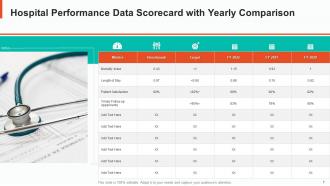
Slide 3: This slide presents 'Hospital Performance Data Scorecard with Yearly Comparison'.
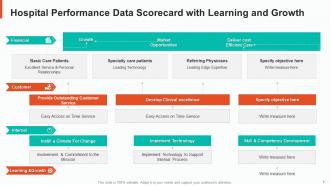
Slide 4: This slide exhibits 'Hospital Performance Data Scorecard with Learning and Growth'.
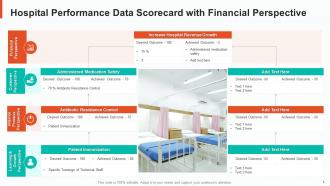
Slide 5: This slide depicts 'Hospital Performance Data Scorecard with Financial Perspective'.
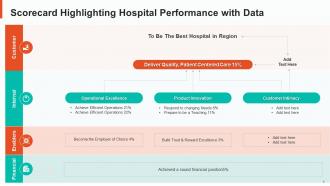
Slide 6: This slide showcases 'Scorecard Highlighting Hospital Performance with Data'.
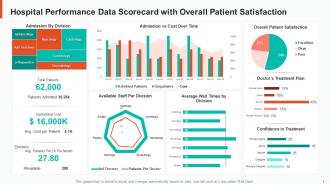
Slide 7: This slide highlights 'Hospital Performance Data Scorecard with Overall Patient Satisfaction'.
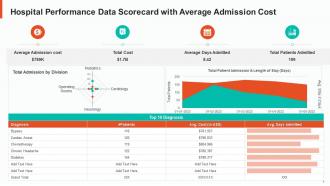
Slide 8: This slide illustrates 'Hospital Performance Data Scorecard with Average Admission Cost'.
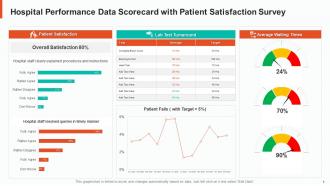
Slide 9: This slide displays 'Hospital Performance Data Scorecard with Patient Satisfaction Survey'.
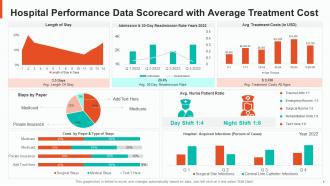
Slide 10: This slide presents 'Hospital Performance Data Scorecard with Average Treatment Cost'.
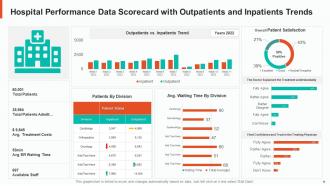
Slide 11: This slide exhibits 'Hospital Performance Data Scorecard with Outpatients and Inpatients Trends'.
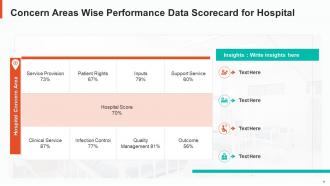
Slide 12: This slide depicts 'Concern Areas Wise Performance Data Scorecard for Hospital'.
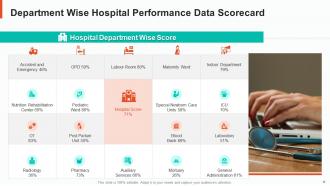
Slide 13: This slide showcases 'Department Wise Hospital Performance Data Scorecard'.
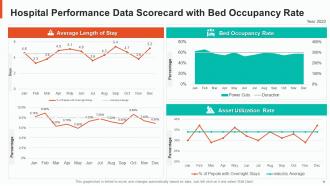
Slide 14: This slide highlights 'Hospital Performance Data Scorecard with Bed Occupancy Rate'.
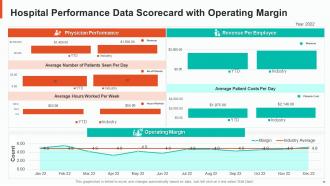
Slide 15: This slide illustrates 'Hospital Performance Data Scorecard with Operating Margin'.
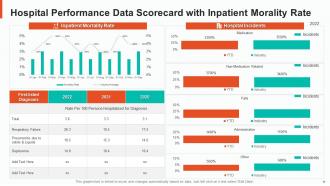
Slide 16: This slide displays 'Hospital Performance Data Scorecard with Inpatient Morality Rate'.
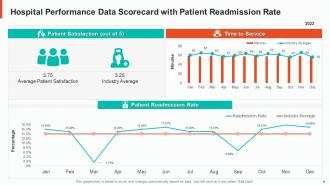
Slide 17: This slide presents 'Hospital Performance Data Scorecard with Patient Readmission Rate'.
Slide 18: This is the icons slide.
Slide 19: This slide shows about your company, target audience and its client's values.
Slide 20: This slide shows details of team members like name, designation, etc.
Slide 21: This slide presents your company's vision, mission and goals.
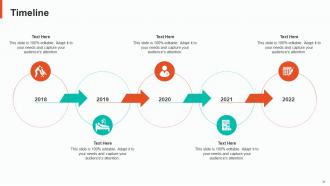
Slide 22: This slide exhibits yearly timeline.
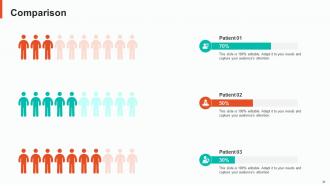
Slide 23: This slide highlights comparison of products based on selects.
Slide 24: This slide displays Venn.
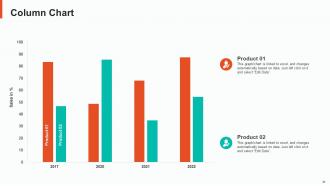
Slide 25: This slide exhibits yearly sales column charts for different products. The charts are linked to Excel.
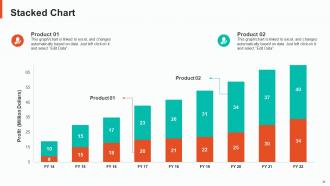
Slide 26: This slide displays yearly profits stacked charts for different products. The charts are linked to Excel.
Slide 27: This is thank you slide & contains contact details of company like office address, phone no., etc.
Hospital performance data scorecard powerpoint presentation slides with all 35 slides:
Use our Hospital Performance Data Scorecard Powerpoint Presentation Slides to effectively help you save your valuable time. They are readymade to fit into any presentation structure.












FAQs for Hospital performance data scorecard
Focus on four big areas: patient safety stuff (infections, readmissions), quality outcomes (satisfaction scores, clinical metrics), how efficiently you're running things (bed usage, length of stay), and financials (cost per case, revenue metrics). Don't go crazy tracking everything though - I've seen hospitals with like 50 KPIs and nobody looks at half of them. Stick to 8-12 that actually matter to your strategy. Mix some leading indicators (staff engagement) with lagging ones (patient outcomes). Honestly? Just start with whatever your board reviews every month. That's your baseline right there.
Start with HCAHPS scores - they're standardized so you can compare against other hospitals. Focus on overall rating, nurse/doctor communication, and recommendation likelihood. Press Ganey's solid for more detailed feedback too. Here's the thing though: don't just look at raw scores. Break everything down by unit, shift, and patient type so you can spot actual problem areas. Bedside tablets are clutch for real-time feedback - way faster than waiting for monthly reports. Oh, and track trends over time instead of isolated snapshots. Your teams need to see if their changes are moving the needle.
Honestly, data analytics is what separates legit hospital scorecards from those fancy-looking dashboards that don't mean much. You'll catch all the weird data entry mistakes (and trust me, there are always some) plus spot the outliers messing with your numbers. It helps validate you're actually measuring the right stuff too. The predictive part is pretty cool - you can see problems coming before they hit. I'd start by just looking at what data sources you have now and figure out where things get wonky. That's usually where analytics saves the day.
Honestly, just tailor the metrics to what each department actually cares about. ED should track wait times and patient flow - that's their bread and butter. Surgery needs infection rates and how many procedures they're cranking out. ICU? Mortality rates and length of stay, obviously. The real trick is getting department heads involved in picking their own metrics. Nobody wants scorecards forced on them from above. I'd literally just ask each team what 3-5 numbers they'd want to see weekly. What keeps them stressed at 2am? Start there and build out. Way easier than guessing what matters to them.
First thing - dig into the actual data and talk to your staff to find the real problems, not just what's on the surface. Pull together teams with people from different departments, but honestly? The frontline nurses and techs usually have the best insights since they're dealing with this stuff every day. Try small changes first instead of overhauling everything at once. Measure how it's going weekly, then expand whatever's actually working. Regular check-ins help you pivot quickly when something isn't clicking. Oh, and don't forget to celebrate the small wins - it keeps everyone motivated when they see progress happening.
Okay so financial stuff usually makes up like 25-40% of your scorecard - operating margins, revenue per patient, that kind of thing. Here's what's annoying though: if your finances are trash, you literally can't do anything else well. Can't hire good staff, can't buy decent equipment, can't improve quality. Then those scores tank too. It's this whole domino situation that honestly drives me crazy. Don't think of financial metrics as their own separate thing when you're planning improvements. They're basically what funds everything else you're trying to accomplish.
Ugh, data quality is gonna be your biggest nightmare. All your systems - EMRs, billing, clinical stuff - they're like speaking different languages so you get these annoying gaps everywhere. People are inconsistent too, which drives me crazy. One person documents completely different from the next shift. Plus you're always reporting on old data from weeks ago. Honestly? Start with standardizing how people enter stuff first. Yeah, and get decent integration tools even though they seem expensive upfront. Trust me on that one.
Honestly, the biggest game-changer is setting up dashboards that pull from all your systems automatically - EMR, financials, quality databases, whatever you're using. No more manually grabbing numbers from five different places (which is soul-crushing work anyway). Modern visualization tools are actually pretty decent at catching trends and weird outliers before you do. You can even set up alerts so when something hits a critical threshold, boom - you get notified right away. I'd start by figuring out which data sources you're pulling manually and check if they've got API connections. Most do these days.
Raw numbers don't tell the whole story, honestly. Benchmarking shows you where you actually stack up against similar hospitals instead of just looking at your own trends. Like, you might feel good about a 15% readmission rate until you realize comparable places are hitting 8%. That's a wake-up call. It helps spot areas where you're behind and proves better results are possible since someone else is already doing it. Sometimes you'll find blind spots you didn't even know existed - which is kinda humbling but useful. Start with 3-5 hospitals that match your size and demographics. Your state hospital association can help you get their metrics.
Monthly updates work best for most hospitals - keeps things current without driving your teams crazy. I've watched places do weekly updates and honestly? People just tune out from all the data noise. Quarterly feels way too slow when you're trying to catch problems early. Match it up with your quality meetings and reporting schedule. Safety stuff might need real-time tracking, but your main scorecard hits different with that monthly beat. Start monthly and see how leadership actually engages with it - you can always tweak from there.
Your scorecard numbers are basically a mirror of how engaged your staff is. Engaged teams = better patient satisfaction, fewer mistakes, lower turnover. Makes total sense when you think about it - a burnt out nurse isn't giving great bedside manner or catching those critical details. And here's the thing that really gets me: when morale tanks, your best people bail first. Then you're stuck short-staffed, which makes wait times worse and quality suffers. I've seen the data on this - hospitals with happy employees consistently crush their clinical metrics. So honestly? If your numbers suck, start with those staff satisfaction surveys.
Look, scorecards are basically your bridge between daily hospital stuff and those big-picture health goals everyone's always talking about. Map your current metrics to whatever initiatives your region cares about - patient safety, readmissions, whatever. Your infection rates suddenly matter more when staff see they're tied to the safety push happening everywhere. I always think of it like connecting dots for people. Pick 2-3 major healthcare initiatives in your area first, then work backwards to see which metrics you're already tracking that support them. Makes the whole thing less overwhelming, honestly.
So you'll want to cover three main things: how to read the data, your company's specific metrics, and just navigating the system itself. Honestly, most people freak out when they first see all those numbers - super common though! Train department heads first, then let them handle their teams. Focus on the metrics that actually matter for each person's job and teach them to look for trends instead of obsessing over every tiny detail. The platform training is pretty quick, maybe two hours max. Oh and definitely schedule some follow-up sessions because people forget this stuff way faster than you'd think.
Alright, so make your scorecards public and actually keep them updated with real stuff - patient satisfaction, infection rates, readmission numbers. Put them somewhere obvious on your website, not hidden in some random PDF. Here's the thing though: don't just show off your good numbers. Include the messy stuff too where you're not doing great. I'd start with maybe 5-8 key metrics and update monthly. Also throw in ways for patients to give feedback so they can call BS if your data doesn't match what they experienced. Honestly, consistency matters more than perfection here.
Oh man, patient safety basically dominates hospital scorecards. They weight it just as much as clinical outcomes and financials - sometimes more. Infection rates, med errors, patient falls, readmissions... all that stuff eats up like half your total score. Regulators are obsessed with it (rightfully so, I guess). Your reimbursement rates depend on these numbers, plus they publish everything publicly now so patients can see how you stack up. Really makes or breaks your rep with other docs too. If you're trying to boost your scorecard, honestly I'd tackle safety metrics first. They're usually easier fixes and give you the biggest bang for your buck.
-
Best way of representation of the topic.
-
Perfect template with attractive color combination.
-
Perfect template with attractive color combination.